Download
1 / 13
130 likes | 218 Views
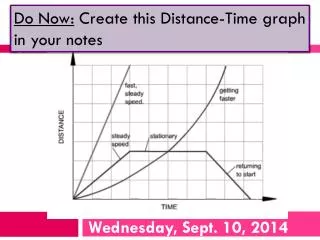
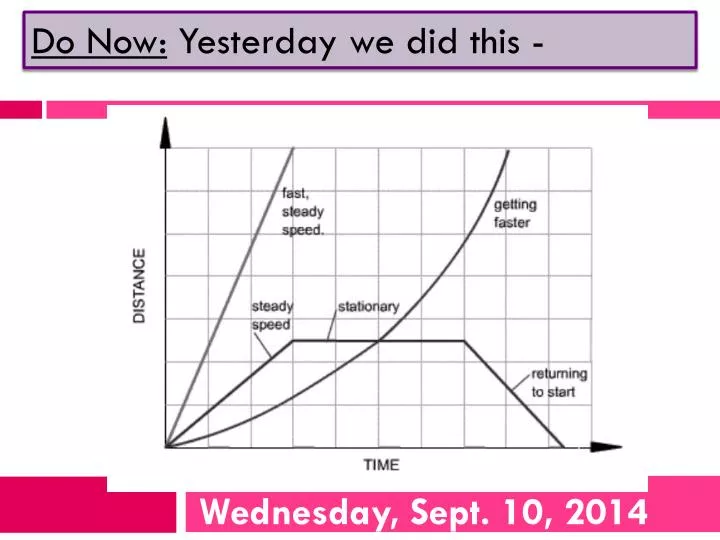
Do Now: Yesterday we did this -. Wednesday, Sept. 10, 2014. DISTANCE-TIME GRAPHS. A distance-time graph tells us how far an object has moved with time. The steeper the graph, the faster the motion.

E N D
Do Now:Yesterday we did this - Wednesday, Sept. 10, 2014
DISTANCE-TIME GRAPHS • A distance-time graph tells us how far an object has moved with time. • The steeper the graph, the faster the motion. • A horizontal line means the object is not changing its position - it is not moving, it is at rest. • A downward sloping line means the object is returning to the start.
SPEED-TIME GRAPHS • A speed - time graph shows us how the speed of a moving object changes with time. • The steeper the graph, the greater the acceleration. • A horizontal line means the object is moving at a constant speed. • A downward sloping line means the object is slowing down.
By the end of the day today, IWBAT… • Analyze characteristics of graphs and interpret differences in velocity & acceleration. Why it matters in LIFE: We interact with velocity and acceleration every day. Understanding how to read graphical interfaces helps to develop your abstract reasoning skills. Why it matters in THIS CLASS: Unit #1-2 Exam this Thusday, October 2, 2014. BE PREPARED!
Wednesday, 09/10/14 C-Notes!
Graph Matching Activity • You have several graphs in front of you • Select the Information that accompanies each graph and match them together • Once you have the correct matches, you will create a notebook foldable to study
If You haven’t finished your Post-It note Fold-Ups! • On the Post-It Notes, draw the graph outline, then stick onto a piece of paper. • Underneath, write the important facts about the graph. • You can flip up the Post-Its when you study, checking the details for each graph underneath.
Create Your Own Graphs • Now create your own situations to graph – use a runner, a car – whatever! Then the class will draw: • a DISTANCE vs. TIME GRAPH • a VELOCITY vs. TIME GRAPH
Create Your Own Graphs • Create two graphs that show a runner’s path: He travels UP a STEEP hill, then DOWN a STEEP hill, then ACROSS a FLAT plain. Think about what he would look like and make: • a DISTANCE vs. TIME GRAPH • a VELOCITY vs. TIME GRAPH
Don’t Forget Your Unit 2: 1D Kinematics Cover Sheet The Unit2 Cover Sheet goes into your journals to keep track of your completed daily work prior to the exam. Record all assignments and keep it together. YOUR FIRST BINDER CHECK IS ON FRIDAY!
Tuesday, 09/09/14 C-Notes!
Tuesday, 09/09/14 C-Notes!