Download
1 / 33
330 likes | 382 Views
Nicholas Mitsakakis Dept of Public Health Sciences University of Toronto. Exploring the use of mass spectrometry data for differential proteomics. Finishing my 1 st year of PhD program in Biostatistics Work originally produced for the requirements of our “Lab in Statistical Design” course

E N D
Nicholas Mitsakakis Dept of Public Health Sciences University of Toronto Exploring the use of mass spectrometry data for differential proteomics
Finishing my 1st year of PhD program in Biostatistics • Work originally produced for the requirements of our “Lab in Statistical Design” course • Data from Dr. Andrew Emili’s laboratory, Banting and Best Dept of Medical Research, UofT • Just first exploratory steps!
Overview • Background • Data • Objectives of the analysis • Methods-Results • Conclusions • Next steps
Some definitions: Proteomics • “The study of the proteome, the complete set of proteins produced by a species, using the technologies of large-scale protein separation and identification” Medterms.com • “The large-scale, high-throughput analysis of proteins” CHA Cambridge Healthtech Advisors, Clinical Genomics: The Impact of Genomics on Clinical Trials and Medical Practice, 2004 • “It represents the effort to establish the identities, quantities, structures and biochemical and cellular functions of all proteins in an organism, organ, or organelle, and how these properties vary in space, time and physiological state” Defining the Mandate of Proteomics in the Post- Genomics Era, National Academy of Sciences, 2002
Protein is a complex molecule consisting of a particular sequence of amino acids • A sequence of amino acids forms a peptide (monomer) • Different peptides joined together form a protein (polypeptide - polymer)
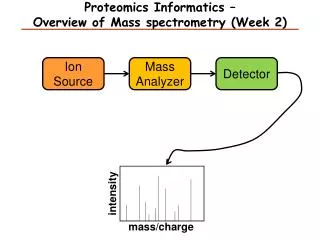
Mass Spectrometry: “An instrument used to identify chemicals in a substance by their mass and charge. Mass spectrometers are instruments that essentially weigh molecules. A mass spectrometer also can measure how much of a compound is present in a mixture”, medterms.com “In a typical approach, this technique for measuring and analyzing molecules involves introducing enough energy into a target molecule to cause its disintegration. The resulting fragments are then analyzed, based on their mass/ charge ratios, to produce a molecular fingerprint“, CHI Predictive Pharmacogenomics report In our data, for each found peptide a confidence value was calculated (Kislinger et al, 2003) and returned Direct analysis of protein complexes using mass spectrometry - Andrew J. Link et al., Nature Biotechnology17, 676 - 682 (1999)
The (almost raw) data: an excerpt protein peptide sequence confidence 3BH1_MOUSE K.TSEWIGTIVEQHR.E 0.8018 3BH7_MOUSE R.HFGYKPLFSWEESR.T 0.8036 3BH7_MOUSE R.HFGYKPLFSWEESR.T 0.9958 3BH7_MOUSE R.HFGYKPLFSWEESR.T 0.9958 3BH7_MOUSE R.HFGYKPLFSWEESR.T 0.9763 3BH7_MOUSE R.HFGYKPLFSWEESR.T 0.9954 3BH7_MOUSE R.HFGYKPLFSWEESR.T 0.8693 3BH7_MOUSE R.HFGYKPLFSWEESR.T 0.9958 3BH7_MOUSE R.HFGYKPLFSWEESR.T 0.986 41_MOUSE R.SLDGAAAAESTDR.S 0.7168 5NTD_MOUSE R.GPLAHQISGLFLPSK.V 0.8122 5NTD_MOUSE R.GPLAHQISGLFLPSK.V 0.8943 A1AG_MOUSE K.AVTHVGMDESEIIFVDWK.K 0.8105 A1AG_MOUSE K.AVTHVGMDESEIIFVDWK.K 0.9284 A1AG_MOUSE K.AVTHVGMDESEIIFVDWK.K 0.9243 A1AG_MOUSE K.AVTHVGMDESEIIFVDWK.K 0.9033 A1AG_MOUSE K.AVTHVGMDESEIIFVDWK.K 0.8206 A1AG_MOUSE K.AVTHVGMDESEIIFVDWK.K 0.9332 A1AG_MOUSE K.AVTHVGMDESEIIFVDWK.K 0.9464 A1AG_MOUSE K.HGAFMLAFDLK.D 0.99 A1AG_MOUSE K.YEGGVETFAHLIVLR.K 0.9619 A1AG_MOUSE K.YEGGVETFAHLIVLR.K 0.7187 ………………………………………………………………… ………………………………………………………………… • - Level of confidence about whether the particular peptide instance was identified • - confidence cutoff value → number of peptides identified (counts) • different cutoff values = different “number of counts” for the peptides • Different covariates (?) not shown • The experiment ran 7 times Peptide 1 Peptide 2 Peptide 3
General (long term) objective • Use the data from the mass spec to obtain (semi)quantitative information about the (relative) abundances of the proteins in the mixtures • Relative: Most interested in comparing abundances of the same protein between two mixtures (biological samples) • Construct measures (scores) and appropriate statistical tests that identify significant differences in protein abundances between 2 different mixtures • Measures should: • “reflect” abundance of the proteins • have nice statistical properties
Using counts • Count: how many times a peptide was identified (peptide level measure) • Previously suggested as semi-quantitative measure of protein abundance (Liu et al., 2004, Collinge et al., 2005) • Issues: • Define appropriate confidence cutoff threshold value for the peptide counts • Construct protein level measures (by combining the peptide counts of each protein) • In both peptide and protein level, low “variation” among experiments is desirable
Selecting appropriate cutoff value Mean of counts cutoff avg # of peptides value identified 0.75 2091 0.8 1897 0.85 1704 0.9 1518 0.95 1271 Log values Variance of counts Threshold values Log values Higher threshold gives less peptides but of higher confidence and of generally lower variance The cutoff value of 0.9 was selected Threshold values
The processed count data – an excerpt Some proteins represented by only one peptide, some others by more than one
Searching for the best protein measure For i = 1,…P, P number of proteins For j = 1,…p(i),p(i) number of peptides for protein i If cij is the number of counts for peptide j, then si= g(ci1, ci2,…cip(i))is the score for protein i For every i, one can see Ci= (ci1, ci2,…cip(i))as a random vector and g(Ci) as a statistic, estimator of (a function of) the abundance of protein i. Three sensible (and suggested) candidates for function g are mean, max and sum; call them m, M and S.
Specific Research Question: Looking for the function that gives smaller variation across the 7 experiments In order to compare the estimators an adjustment was made so that they have equal mean values (across the 7 experiment) for every i. We use S as baseline estimator. The other two need to be adjusted. Denoting gi = g(Ci) where g is m, M or S, we use the equations: m_adji = ai * mi, where ai = avg(Si)/avg(mi) M_adji = bi * Mi, where bi = avg(Si)/avg(Mi)
We keep 1241 selected proteins with 2 or more counts in all peptides and experiment • ~700 proteins have only one peptide => ai = bi = 1 • a_i: median=1, mean=1.51, max = 16.29 • b_i: median=1, mean=1.20, max = 4.47 The relationships between the 3 statistics depend on the protein
Comparing the variances of the 3 measures mean max sum mean m M S mean 12.226 11.828 8.592 median 0.619 0.619 0.667 over 1241 proteins >(=) m M S m 0(1241) 129(870) 168(749) M 242(870) 0(1241) 226(745) S 324(749) 270(745) 0(1241) max sum
As a conclusion: “mean” of peptide counts per protein seems to be a slightly more stable statistic • Similar results were generated when Coefficient of Variance (std/mean) was used instead of variance, as a measure of relative variation (to cope with the fact that the 3 measures have different mean values per protein)
Next step: using covariates to identify “unstable” peptides • Mass of the peptide • Charge (values 1, 2 or 3) • higher # of counts gives higher variance => coefficient of variation was used as a measure of variability • Tests and model fitting showed evidence that: • Peptides with Charge =3 have higher variability • Higher mass gives higher variance BUT not higher CV
Weighted mean • Peptides with charge = 3 (i.e. “unstable”) were weighted less • The formula used is: wmi = • ch(j): charge of peptide j, • Kl, kh: numbers of low charge (1 or 2) and high charge (3) peptides respectively, • wl,wh:weights for the low and high charge peptides respectively • I used wl = 2*wh Unfortunately the weighted mean did not produce values of lower variance …
First model fitting efforts • Outcome: count cij • Covariates: mij, chij, ai(unknown) • Fit a log-linear model • Eliminate the effect of abundance by normalizing per protein • For the covariates, subtract the arithmetic mean • For the outcome (counts), divide by the geometric mean Poisson model gave very high over-dispersion, so a Negative Binomial model was used
Using the un-normalized count data Criteria For Assessing Goodness Of Fit Criterion DF Value Value/DF Deviance 15E3 14231.8717 0.9243 Scaled Deviance 15E3 14231.8717 0.9243 Pearson Chi-Square 15E3 46419.6434 3.0148 Scaled Pearson X2 15E3 46419.6434 3.0148 Log Likelihood 28490.0270 Algorithm converged. Analysis Of Parameter Estimates Standard Wald 95% Confidence Chi- Parameter DF Estimate Error Limits Square Pr > ChiSq Intercept 1 0.7605 0.0142 0.7326 0.7884 2856.13 <.0001 mass 1 -0.0004 0.0000 -0.0005 -0.0003 97.88 <.0001 charge_mean 1 1.4668 0.0733 1.3232 1.6105 400.37 <.000 Dispersion 1 2.6255 0.0400 2.5471 2.7039
Using the normalized count data Criteria For Assessing Goodness Of Fit Criterion DF Value Value/DF Deviance 15E3 16036.8557 1.0416 Scaled Deviance 15E3 16036.8557 1.0416 Pearson Chi-Square 15E3 18308.3152 1.1891 Scaled Pearson X2 15E3 18308.3152 1.1891 Log Likelihood 210259.2628 Algorithm converged. Analysis Of Parameter Estimates Standard Wald 95% Confidence Chi- Parameter DF Estimate Error Limits Square Pr > ChiSq Intercept 1 1.9767 0.0139 1.9494 2.0039 20202.8 <.0001 mass 1 -0.0003 0.0000 -0.0003 -0.0002 32.89 <.0001 charge_mean 1 0.8567 0.0758 0.7082 1.0052 127.85 <.0001 Dispersion 1 2.8378 0.0338 2.7716 2.9040 ???
Conclusions • Verification that selecting higher threshold for confidence values gives overall more “stable” peptide counts • “mean” outperforms (even marginally) “max” and “sum” as a protein level measure • Peptides with charge = 3 seem to be more “unstable” • Implemented “weighted mean” did not improve stability • A log-linear model seems to fit the count data -> first step for more complex models for acquiring more refined and informed protein level measures (?)
Next steps • Data with true protein abundances would be useful • Exploring model fitting (hierarchical GLM models) • Effects of other covariates (peptide sequence) could be explored (could be hard!) • Break down the MS experiment process into smaller processes and model accordingly • Use data of known varying abundances to evaluate the protein measures
Acknowledgements Biostatistics - PHS Rafal Kustra Emili Lab – BBDMR Andrew Emili Clement Chung Thomas Kislinger
Selecting appropriate dispersion measure Variance depends on mean Coefficient of Variance (std/mean) - it provides a relative (rather than an absolute) measure of dispersion – it is independent of the mean => Use coefficient of variance instead
1241 proteins with more than 1 peptide count total in all 7 experiments Each dot corresponds to a protein Y axis: difference between the CV values of two measures X axis: protein rank when ordered increasingly by the average value of the measure mentioned first As we move from (hypothetically) lower abundance to higher abundance proteins the order of quality of measures changes For low/medium abundance proteins, “mean” is better more often If we are interested in lower/medium abundance proteins mean appears to be better measure
Comparing the Coefficient of Variance of the three measures The three measure functions show similar behavior Mean is marginally better Exploring further: comparing performance trends with respect to protein abundance…
Stats per Confidence cutoff values #of peptides identified cutoff: 0.75 mean: 2091 var: 59451 cutoff: 0.8 mean: 1897 var: 50075 cutoff: 0.85 mean: 1704.43 var: 44376.6 cutoff: 0.9 mean: 1518.71 var: 32945.6 cutoff: 0.95 mean: 1271.14 var: 22605.5 # of proteins identified cutoff: 0.75 mean: 1336.86 var: 22985.1 cutoff: 0.8 mean: 1186.57 var: 18895 cutoff: 0.85 mean: 1042.86 var: 16031.5 cutoff: 0.9 mean: 909.714 var: 11183.6 cutoff: 0.95 mean: 742.714 var: 7599.24 Peptides per protein cutoff: 0.75 mean: 1.56503 var: 0.0034228 cutoff: 0.8 mean: 1.59964 var: 0.00315881 cutoff: 0.85 mean: 1.63534 var: 0.00320114 cutoff: 0.9 mean: 1.67008 var: 0.00298823 cutoff: 0.95 mean: 1.71291 var: 0.00440239
Other covariates • Peptide Charge • SEQUEST output (from which the confidence values are estimated) • Number of scan for the peptide (related to the time when the peptide entered the mass spec) • Patterns in the peptide sequence itself (motifs)
The mass-spectrometry/proteomic experiment The ABC’s (and XYZ’s) of peptide sequencing-Hanno Steen & Matthias Mann, Nature Reviews Molecular Cell Biology5, 699 -711 (2004)
spectra SEQUEST, Eng et al, 1994 Correlation scores STATQUEST, Kislinger et al, 2003 Confidence values “Using the SEQUEST algorithm, acquired fragmentation spectra of peptides are correlated with predicted amino acid sequences in translated genomic databases”