Download
1 / 25
250 likes | 381 Views
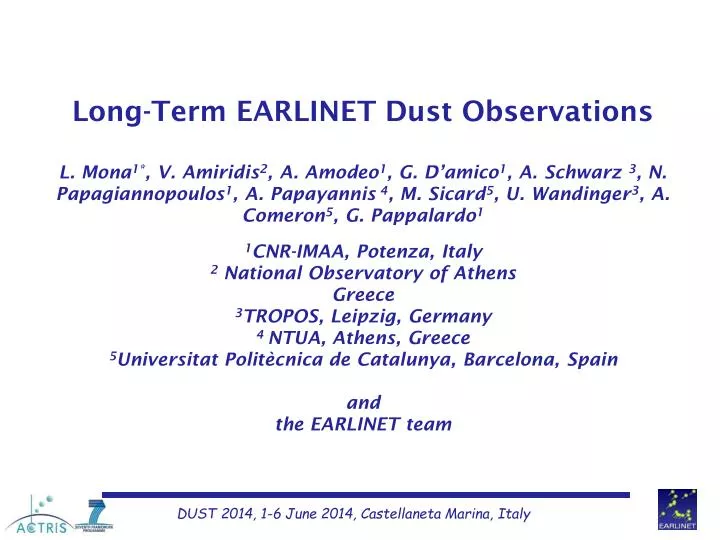
Long-Term EARLINET Dust Observations L. Mona 1* , V. Amiridis 2 , A. Amodeo 1 , G. D’amico 1 , A. Schwarz 3 , N. Papagiannopoulos 1 , A. Papayannis 4 , M. Sicard 5 , U. Wandinger 3 , A. Comeron 5 , G. Pappalardo 1 1 CNR-IMAA, Potenza, Italy 2 National Observatory of Athens Greece

E N D
Long-Term EARLINET Dust Observations L. Mona1*, V. Amiridis2, A. Amodeo1, G. D’amico1, A. Schwarz 3, N. Papagiannopoulos1, A. Papayannis 4, M. Sicard5, U. Wandinger3, A. Comeron5, G. Pappalardo1 1CNR-IMAA, Potenza, Italy 2 National Observatory of Athens Greece 3TROPOS, Leipzig, Germany 4 NTUA, Athens, Greece 5Universitat Politècnica de Catalunya, Barcelona, Spain and the EARLINET team
EARLINET-ASOS EARLINET (European Aerosol Research LIdar NETwork) • since 2000 • 27 lidar stations • 10 multiwavelength Raman lidar stations • 10 Raman lidar stations • 7 single backscatter lidar stations • comprehensive, quantitative, and statistically significant data base • Continental and long-term scale www.earlinet.org
EARLINET • EARLINET started in 2000 under FP5 based on research aerosol lidar stations already available around Europe. • Different lidar set-ups and software analysis around the network. • Main strengths of the network:sharing the single station know-how for a continuous improvement of the network as a whole and acting as a single body. • EARLINET pillars: • Quality assurance • Optimization of the instruments • Optimization of the data processing • Centralized measurements scheduling
EARLINET products Lidar Range Corrected Signal: almost raw signal unless background subtraction and multiple by range^2 provides rapid snapshot of temporal - vertical evolution of aerosol layers Etna 2002 Volcanic eruption – Potenza, Southern Italy Pappalardo et al., GRL, 2004, Villani et al., JGR 2006, Wang et al., Atm. Env. 2008
EARLINET products • EARLINET standard products : • -Aerosol backscatter coefficient • (355, 532 and 1064 nm) • -Aerosol extinction coefficient • (355 and 532nm) • -Linear particle depolarization ratio • (355 and 532 nm) • These quantities are reported in the EARLINET database in the netcdf standardized format. • -Lidar Ratio • (355 and 532 nm) • -Angstrom exponent • (355 and 532nm) • -Backscatter related Angstrom exponent • (355 -532 nm , 532-1064 nm) • These are important for the aerosol typing because do not depend on aerosol quantity.
FT layer SUV=51±10 sr SVIS=53±8 sr AODUV=0.17 AODVIS=0.11 δ=0.12±0.03 Å = 0.9 ± 0.2 PBL EARLINET products AODUV=0.26 AODVIS=0.19
EARLINET desert dust observations A suitable observing methodology has been established within the network for studying Saharan dust events. Measurements are performed in correspondence of alerts based on the operational model outputs diffused 24 to 36 hours prior to the arrival of dust aerosols . Typically measurements are performed for more than 3 hours to investigate the temporal evolution of the dust events. All these data are collected in the Saharan dust EARLINET subset. Subset published on CERA database: doi:10.1594/WDCC/EN_SaharanDust_2000-2010
Systematic dust observations over Europe First study on the impact of Saharan dust on European aerosol content during the first period of operation of the network (2000–2002) Central Europe shows low dust transport activity Papayannis et al. JGR 2008
Systematic dust observations over Europe AOD at 351–355nm inside the dust lofted layers Values in 0.1 -0.25 range with a standard deviation of the order of 20–100% that clearly indicates the high variability of the dust outbreaks over Europe.
Systematic dust observations over Europe Papayannis et al. JGR 2008 S values ranged between 38 and 60 sr inside the dust layer, while their standard deviation is of the order of 20–30%.
Typical values of intensive properties • Northern Europe • linear particle depolarization ratio values range from 10 to 25% at 532nm • approximately constant A° (β355/532) values (−0.5 to 1) • approximately constant S values (30 to 80 sr) • Southern Europe • S (20 to 100 sr) with high variability • A° (β355/532) (−0.5 to 3) highly variable • linear particle depolarization ratio values as high as 35 % at 532nm • Cyprus: a new EARLINET station for Arabian dust • S at 532 nm between 34 – 39 sr for dust event in 2011 • 28%–35% linear particle depolarization ratio Papayannis et al. JGR 2008 Mamouri et al., GRL 2013
Dust mixture • Among cases in May 2008–October 2009 period: • only 12% of cases pure Saharan dust cases • Mixing of dust with others in 88% of the cases • The mixtures of dust, pollution, and marine aerosol are the most frequently obtained. All mixtures lie on nearly straight connecting lines between their constituents. Wandinger, Executive summary ESTEC, 2011
Satellite validation: CALIOP Lev2 data Criteria: 100 km of distance (maximum) largest single station databases. 2.5-5km: Scal=41.1 sr vs Sear=47.7sr with 7 sr bias. This is probably due to the Saharan dust occurrences at this altitude range and stations.
Satellite validation: CALIOP Lev2 data • Observations (airborne in situ + lidar ) in pure dust in the Saharan plume (SAMUM campaign) : • in the CALIPSO retrieval of backscatter coefficients, the a priori lidar ratios from the lookup table of 40 sr used for dust represents an effective value that accounts well for the reduced attenuation caused by multiple scattering • the CALIPSO extinction values calculated by multiplying the backscatter values with the effective lidar ratio, a systematic underestimation of extinction, and thus in optical depth by 10%–40% Wandinger et al GRL 2011
EARLINET vs BSCDREAM-8b 12-year one site systematic comparison Potenza (Italy) station selected as the site with the largest database of dust profiles. Comparison for May 2000 – June 2012 period between lidar observations and BSC-DREAM8b forecasts over Potenza. Only cases in which a Saharan dust layer is identified in the lidar profiles are compared. Comparison is performed in terms of dust layer geometrical properties (base, top, extension and center of mass) and of dust extinction properties. Mona et al. ACP 2014 - on review
EARLINET vs BSCDREAM-8b 12-year one site systematic comparison Geometrical features of dust layer are well described by the model in terms of center of mass. Mona et al. ACP 2014 - on review Good correlation between optical properties and concentration profiles apart from cases with low dust load (AOD <0.1)
EARLINET vs BSCDREAM-8b 12-year one site systematic comparison Differences below 17%: S: 60 ± 13 sr Angstrom 0.1 ± 0.6 Differences higher than 85%: Angstrom 0.5 ± 0.6 Relative difference in extinction Mona et al. ACP 2014 - on review All these aspects indicate that the level of agreement decreases with increasing of mixing/modification processes.
Models evaluation • The methodology will be used to extend the study to all EARLINET stations but also to other models. • BSC-DREAM8b and DREAM8-SEEVCCC • Granada Potenza Napoli Athens Thessaloniki and Leipzig are selected for temporal coverage and geographical position. • Currently in progress, the comparison of LIRIC (lidar+sunphotometer) mass concentration profiles with models.
Models evaluation BSC-DREAM8b predicts exceptionally well the start of the event. After 5 days the prediction is not so good.
NRT data provision ACTRIS Summer 2012 campaign. ACTRIS and EMEP have worked close together to coordinate this intensive field campaign mainly devoted to study Saharan dust particles. The observation period (8 June – 17 July) scheduled for cooperation with CHARMEX and PEGASOS measurement campaigns Two intense African dust outbreaks were observed: 18-21June, and 28 June – 6 July. Qualitative agreement with mineral dust analyses performed by EMEP stations (EMEP status report 2/2013), on the levels and composition of PM10. Papagiannopoulos et al POSTER Monday-Tuesday MF2
ACTRIS Summer 2012 campaign • EARLINET operationality exercise: • 72h of continouos measurements • Range corrected signals were assimilated in an Air Quality Model • A centralized and automatic procedure for lidar data pre-processing and analysis was used (Single Calculus Chain - SCC) • Chemistry transport model POLAIR3D of the AQ platform Polyphemus (K. Sartelet / M. Bocquet, CEREA, France)
ACTRIS Summer 2012 campaign Comparison with EMEP model. VISUAL COMPARISON Structures well captured. Some delay in structures for eastern mediterranean stations Tsyro et al ORAL Thrusday Limassol, Cyprus Lidar Model
ACTRIS Summer 2012 campaign Comparison with EMEP model. QUANTITAVE COMPARISON Good agreement for Central Med Some discrepancies moving toward East Tsyro et al ORAL Thrusday
Way forward • EARLINET long term observations will be used for systematic models evaluations • EARLINET stations could be used as “core sites” for the operational networks based on less advanced lidar instruments. • After first promising results, NRT lidar data and assimilation will be investigated • Develop new EARLINET data products related to dust (e.g. dust backscatter profile) • Synergistic approach with other remote sensing sensors will be exploited for ICN and NWP studies
Thank you! lucia.mona@imaa.cnr.it www.earlinet.org