Download
1 / 9
90 likes | 213 Views
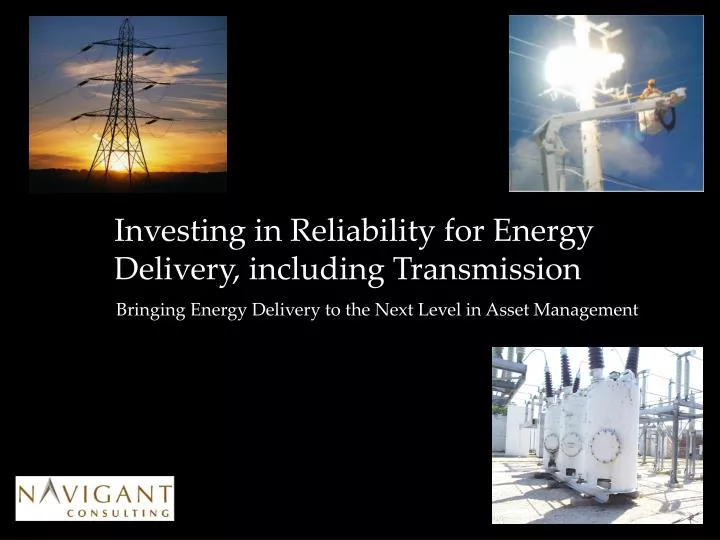
Investing in Reliability for Energy Delivery, including Transmission. Bringing Energy Delivery to the Next Level in Asset Management. Today’s utility has to tell a different story The shift is from global energy traders to regional asset owner/managers.

E N D
Investing in Reliability for Energy Delivery, including Transmission Bringing Energy Delivery to the Next Level in Asset Management
Today’s utility has to tell a different story The shift is from global energy traders to regional asset owner/managers Today’s utility has to have a different story to tell investorsThe shift is from global energy traders to regional asset owner/managers Who we are NOT: Who we ARE: Asset-less ‘trading’ company Owner/manager of utility assets Trading floor Global acquirer of risky assets Selected acquirer of ‘related’ assets Highly leveraged and un-hedged Prudent manager of all risks Debt risk Equity
Spending prioritization has become a board-level issueBoards want to see what is driving the business’ needs for cash The capital prioritization process has become a board-level issueBoards want to see what is driving the business’ needs for cash “The board of directors has asked to see the process by which we make decisions about major commitments of capital” – A major multi-region investor-owned utility “The board wanted to get behind the presentation of the budget and look at the drivers of cost and where it was taking us” – A large southwestern municipal “The board is not satisfied with a process where we all get in a room and use our best judgment. They want to see a method.” – A major northeast investor-owned utility
Spending prioritization is the core of asset management The ‘decision tool’ ranks each major project/option by its ‘bang per buck’ • Option Development • Developing • cost-effective alternatives for possible funding • Additions • Upgrades • Replacement • Maintenance • Standards • Systems • Results Monitoring • Measuring & managing the drivers of the funded projects and processes • Benchmarking • Unit costs • Failure rates • Event impacts • Value added Funding Curve
Within this context, all projects can compete for resources Transmission projects compete with distribution, IT, etc. Typical Funding Curve Slope less than 1.0 indicates insufficient value for the cost Focus discussion on projects that are ‘on the margin’ Projects are sorted in order of value/cost : – first ‘no-brainers’ – then ‘close calls’ Projects with Value/Cost > 1.0 Possible Financial Target • About half of each year’s funding is ‘Must Do’ • New Services • Relocations • Failures (restore)
Each project is modeled from cost to impacts to value Providing an activity basis for all projects and categories of spending Each project is modeled from cost to impacts to value Start by entering cost by year… …then model units and unit costs… …then model immediate impacts on value ‘drivers’… …e,g, one component of value is collateral damage avoided cost For each project, the value from each of the components is added up by year, discounted to present value, and compared to the present value of the projects’ cost, to get a value/cost ratio, which determines its ranking in the funding curve: PV of project value / PV of project cost = Value/Cost ratio $2,200,000 / $2,000,000 = 1.10
Value to the company includes avoiding ‘reactive’ costs Companies pay real dollars to deal with customer satisfaction issues What would your company be likely to have to spend if this were the front page of your main city’s newspaper? What would you spend now to avoid having to spend later?
Transmission line load relief projects avoid outages A ‘quick calculation’ example shows how the model works at a high level Project: Reconductor the 4-mile 69kV line from Madison to Brookwood Reason: Loss of Jackson-Centerville line (1st contingency) causes 15% overload on Madison-Brookwood line Jackson 230/69kV Brookwood White Springs Centerville Madison 230/69kV Cost: $800,000 = $200,000 per mile * 4 miles of re-conductored 69kV line Benefit: Avoid an 8% chance of having to shed 13-50 MVA of load for 2 hours during summer contingency Quick calculation: $1,000,000 of benefit; $800,000 of cost; Benefit/cost ratio = 1.25 Outages Exposure MW Outage EMWH Value Annual Present Per YearFactorAt RiskHoursSavedper MWHBenefitValue .4 .2 25 2 4.0 $25,000 $100,000 $1,000,000 • Note: The quick calculation above shows the key drivers, but the model handles more complex details: • Multi-year – Discounted present value of costs and benefits over time • Load growth – Higher load growth leads to more overload over time, hence higher benefits • Voltage drop – Can be modeled by asking how much load must be dropped to restore 93% • Line loss – Reconductoring or cap banks can affect line losses
Investing in transmission reliability must be optimized There are some very cost-effective investments, and some not so For questions or further information, contact: Daniel E. O’Neill | Director DONeill@navigantconsulting.com 404.816.5647 direct