Download
1 / 23
240 likes | 389 Views
Elite Trader. Stock Market Analysis Tool Chris Stallings Scott Clark Ed Pabon. Elite Trader. Introduction

E N D
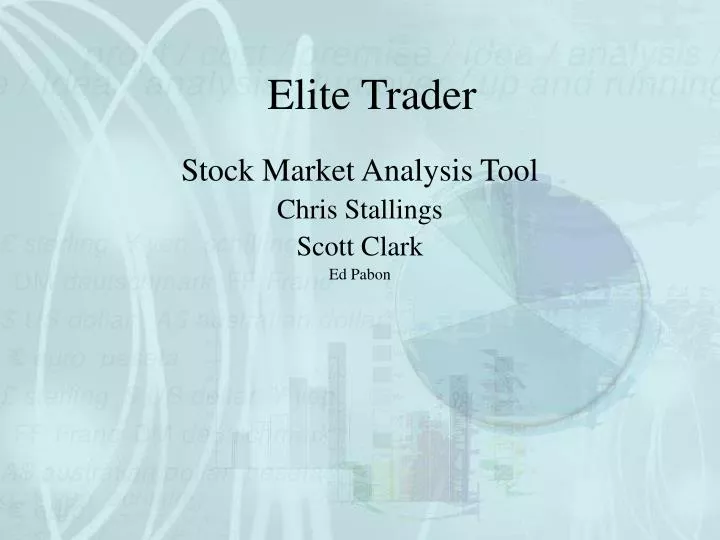
Elite Trader Stock Market Analysis Tool Chris Stallings Scott Clark Ed Pabon
Elite Trader Introduction Elite Trader is a tool used by investors to devise technical strategies for the market. It will draw graphs of prices, indicators, and strategies. Our system will be able to optimize strategies and produce buy and sell points for its users. The user will then be able to trade based on Elite Traders recommendations.
High Level Design Presentation Input Graphical Display Input Language Data Input (C.S.V. files) Price Plotting Indicator/ Strategy Plotting Usage Manage Strategies and Indicators Strategy Definition Indicator Definition Output Most profitable strategy Computed Results Advice on trade timing Strategy Optimization Desired Results Success!
Input • Data Input • Comma separated value files containing O.H.L.C. information. • Input Language • Will be the language in which the program is written.
Presentation • Graphical Display • Price Plotting • O.H.L.C. Bars • Indicator and Strategy Plotting • Indicators may be shown either directly on the price graph or directly below.
Usage • Defining and managing both strategies and indicators. • Elite Trader will compute how the strategy would have performed over a set time period. • Strategies are then optimized to align the computed results with the desired results.
Output • The most profitable strategy will be output after the tweaking stage. • The program may include a feature to follow live or near live stock prices and recommend trades based on the live prices and the optimal strategy.
High Level Design Presentation Input Graphical Display Input Language Data Input (C.S.V. files) Price Plotting Indicator/ Strategy Plotting Usage Manage Strategies and Indicators Strategy Definition Indicator Definition Output Most profitable strategy Computed Results Advice on trade timing Strategy Optimization Desired Results Success!
Elite Trader • Main Menu Items • File • Chart • Strategy • Optimization • Indicator • Profit Center • Help
Elite Trader • File • New Workspace • Open Workspace • Save Workspace • Save Workspace As • Exit
Elite Trader • Chart • New Chart • Symbol / Location • Zoom in • Zoom Out • Chart options • Hide/show data values box • Link chart to others • Open chart • Save chart • Save chart as • Export chart values • Close chart
Elite Trader • Indicator • New Indicator • Open Indicator • Save Indicator • Save Indicator as • Export Indicator values • Insert Indicator • Indicator options • Close Indicator Wizard
Elite Trader • Strategy • New Strategy • Open strategy • Save Strategy • Save Strategy as • Export strategy position values • Strategy options • Apply Strategy to individual asset • Apply Strategy to group of assets • Close Strategy
Elite Trader • Optimization • Optimize Strategy • Revert to previous strategy values
Elite Trader • Portfolio • New Portfolio • Portfolio view • Add Strategy to portfolio • Delete Strategy from portfolio • View / change strategy weights • Save portfolio • Save portfolio as • Close portfolio
Elite Trader • Profit Center • View Strategy results • View Portfolio results
Elite Trader • Help • Language Help • Program Help • Theory Help • About • Credits
Elite Trader - Language that Elite Trader is programmed in used for indicators and strategies creation • Function written in the language of our system. • Take multiple inputs, arrays/values. • One output: Array form. • Put in respected folders in program directory. • Written in text editor. • New indicator / strategy. - Compiles - Ready to be inserted.
Elite Trader Pseudo code Example of Input Language for indicator: Moving_Average Double [] Moving_Average(closes, movAvgLen) { double [] out double closesum = 0; for(int x = movAvgLen;x<closes.length(); x++) { for(int y = x; y> x-movAvgLen;y--) closesum+=close[y] out[x] = closesum/movAvgLen; closesum = 0; } return out; }
Elite Trader Image Courtesy of yahoo finance
Elite Trader Pseudo code Example of strategy: Moving_Average Int [] MovAvgX(closes, smallLen, bigLen) { double [] out; int pos = 0; for(int x = bigLen;x<closes.length(); x++) { if(Moving_Average(closes,smallLen) > Moving_Average(closes,bigLen) pos = 1; if(Moving_Average(closes,smallLen) < Moving_Average(closes,bigLen) pos = -1; out[x] = pos; } return out; }
Elite Trader Wrap Up We feel that elite trader has all of the most important features required to benefit those who make a living off the stock market on a daily basis. It improves on the tools of other competitive programs while providing a more straightforward user interface. Elite Trader represents the next generation in technical analysis programs.