Download
1 / 50
500 likes | 637 Views
Economics. Your One-Day Crash Course!. Today’s Objective. Identify basic micro and macro economic concepts. Supply & Demand Economic Indicators Business Cycle Economic Cycle. Supply & Demand. What is it?. SUPPLY. DEMAND.

E N D
Economics Your One-Day Crash Course!
Today’s Objective Identify basic micro and macro economic concepts. • Supply & Demand • Economic Indicators • Business Cycle • Economic Cycle
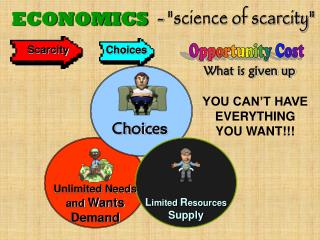
What is it? SUPPLY DEMAND the number of goods that producers are willing to SELL at a particular price the number of goods that consumers are willing to BUY at a particular price
Law of Supply As price increases, the amount producers are willing and able to produce will also increase. P3 P2 P1 Q1 Q2 Q3
Think About it… Name something that is currently in high supply & low demand.
Law of Demand As price increases, the amount that consumers are willing and able to pay will decrease. P3 P2 P1 Q1 Q2 Q3
Think About it… Name something that is currently in low supply & high demand.
Graphing • Equilibrium – supply and demand are equal ** point of max. profit • Shortage – demand exceeds supply • Surplus – supply exceeds demand D S P3 P2 P1 Q1 Q2 Q3
Effects on the Economy • If there is a shortage, this means that there is less supply from producers than there is demand from the consumer. Who has more control over the market? The buyer or the seller? • If there is a surplus, this means that there is more supply from producers than there is demand from consumers. Who controls the market? Seller! Buyer!
REVIEW • Define supply & demand. • Law of Supply • Law of Demand • Parts of a Supply & Demand graph • Seller’s Market vs. Buyer’s Market
How do you measure up? Student performance is measured by: • GPA • SAT • Class Rank Baseball performance is measured by: • Batting Average • Strikeouts
Economic Indicators • Economic indicators are figures used to measure a country’s economic performance. • We measure things like: • how much a country produces • whether a country’s economy is growing • how a country’s economy compares to others
Gross Domestic Product • GDP is the total market value of all goods & services produced in a country in a given year. • Released the last day of each quarter (reflects the previous quarter) • Key: look for the growth rate of GDP (typically 2.5 to 3 % each year)
Measuring the GDP • One of the most important indicators of economy’s status • The U.S. has a very high GDP as compared to other countries. • Examples • Canada: $1.279 trillion • North Korea: $40 billion • China: $8.748 trillion
What GDP Tells Us… • Changes in GDP show whether the economy is growing or slowing • Commonly used to gauge a country’s standard of living
Inflation Rate • Inflation is a general increase in the price of goods & services. • Measured by the Consumer Price Index (CPI) • Released at 8:30 a.m. around the 15th of each month (reflects previous month)
What causes inflation? Supply < Demand • Could result from: • War • Price of imports • Too much money in circulation
What Inflation Tells Us… • Indicates that the cost of living is getting more expensive
Unemployment Rate • Unemployment measures the number of people who are able & willing to work but cannot find work. • Shows whether the economy is picking up or slowing down • Released on the first Friday of each month
Retail Sales Index • Measures goods sold within the retail industry, from huge chains to small local stores • Released around the 12th of the month • Does not include money spent on services • Shows if consumers are spending or saving
In Summary… • What is the purpose of economic indicators? • What is GDP? What does it tell us? • What is the inflation rate? What does it tell us? • What is the unemployment rate? What does it tell us? • What is the Retail Sales Index? • Which indicators are lagging? Which are leading?
The Business Cycle …the economic roller coaster!
The Business Cycle • Economies naturally go through ups & downs. • The business cycle is the rise and fall of economic activity over time. • In the United States… • 1930s, 50s, 70s, 2000s characterized by a drop in economic activity & rise in unemployment • Slumps followed by new waves of increased productivity and increased GDP
Prosperity • Also known as the “peak” • Higher wages, more jobs available, higher demand for goods/services • Unemployment is low, GDP is high • People are spending!
Recession • Economic activity slows down – less production of goods, downturns in industry • GDP decreasing, unemployment increasing • People are starting to save!
Depression • Also known as a “trough” • Deep recession that lasts for years and affects the entire economy • Unemployment is high, GDP is low • Government starts trying to “stimulate” the economy • People are saving!
Recovery • Also known as “expansion” • Rise in business activity after a recession or depression • Innovation occurs – businesses start bringing out new products & services • Unemployment decreasing, GDP increasing
Entrepreneurs Who Rose from the Ashes Many of today’s Fortune 500 companies came from recessions or depressions…
General Motors • The Panic of 1907 • William C. Durant • High school drop-out working as a manager of Buick in Detroit • Acquired Oldsmobile, Cadillac, Pontiac • Launched Chevrolet (later joined GM in 1917)
Playboy Enterprises • Recession of 1953 • Hugh Hefner • Former employee of Esquire who quit when his boss refused to give him a $5 raise • Designed his own magazine with the help of his friends
Sirius Satellite Radio • Early 1990s Recession • Robert Briskman • Former NASA engineer • COO at Geostart (satellite messaging company) • Figured out how to broadcast digital radio signals via satellite • Merged with XM Satellite Radio in 2008 to provide commercial-free radio 24 hrs/day
REVIEW • What are the four stages of the business cycle? • How is each stage characterized by economic indicators? • GDP? Unemployment? Spending or saving?
Who is Particularly Impacted? While the economy as a whole is negatively impacted by economic cycles, certain companies and industries are particularly sensitive to overall changes.
Durable Goods • People tend to cut back on the purchase of durables, as the ones they already have can last through the recession. • Manufacturers of durable goods like cars, appliances, and electronics are among the most impacted. • Durables usually benefit the most from booms. As disposable income increases, consumers are likely to go out and buy a new car or iPod.
Transportation • GM, Ford, Chrysler and other car companies are significantly impacted by recessions. • Consumers put off buying new cars or purchase less expensive models. • United Airlines & British Airways are leading airlines that suffer in recessions. • FedEx & UPS experience less volume in mailed packages during recessions.
Manufacturing • Whirlpool and Sears are home appliance manufacturers subject to decline in demand during recessions. • Demand for appliances is tightly linked to new home sales, which slow during recessions.
Construction • Home Depot & Lowe’s are home improvement retailers. • Performance is correlated to the house market, which declines during recessions.
Other Industries • Investment Services • Merrill Lynch • Morgan Stanley • Goldman Sachs Group • JP Morgan Chase • Hotels • Home Security • Luxury Commodities (jewelry like Zales) • Advertising Firms
Who is Less Impacted? • Certain goods are relatively protected from the impact of economic cycles. Goods that have a relatively inelastic demand with respect to income are generally shielded. • For example, no matter how bad the economy gets, people have to eat and will continue to purchase food. This is particular true for staple foods like bread.
Who is Less Impacted? • Food Manufacturers & Retailers • Safeway • Wal-Mart • Pepsi • Kraft • Addictive Substances (tobacco) • Medicine & Medical Equipment • Utilities
REVIEW • What are durable goods? • Which industries are most significantly impacted by economic downturns? • What is inelastic demand? • Which industries are relatively unaffected by economic rises or falls?
Economics in a Day! Supply & Demand, Economic Indicators, Business Cycle, Economic Cycle