Download
1 / 13
130 likes | 246 Views
Duke University GHG Update/CAP Progress Report. May 13, 2011. President’s Climate Commitment, Climate Action Plan and Greenhouse Gas Inventory Update. Sustainability. 2010 GHG Inventory Update. GHG Inventory Total Duke broken down into

E N D
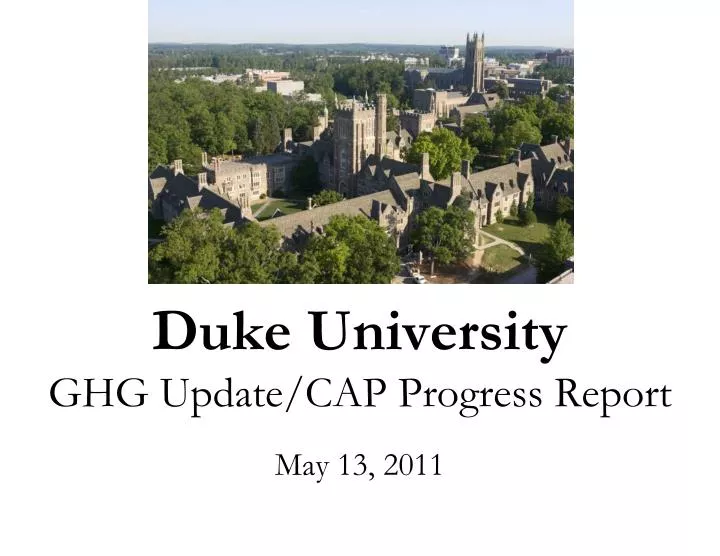
Duke University GHG Update/CAP Progress Report May 13, 2011
President’s Climate Commitment, Climate Action Plan and Greenhouse Gas Inventory Update Sustainability
2010 GHG Inventory Update • GHG Inventory • Total Duke broken down into • University = University/School of Med./School of Nursing • Health System contiguous to Durham campus • CAP target – carbon neutral by 2024 • Only applies to University • Did not include Health System in CAP target
2010 GHG Update ↓5.8% ↓8.9% 2007 levels = 445,561 2008 levels = 448,754 2009 levels = 419,706 2010 levels = 406,109 Baseline 0.7%
2010 GHG Update - University 2007 Baseline 2008 = 0% 2009 = ↓5% 2010 = ↓9% ~30,000 MTeCO2 reduced = 5240 cars removed from the road for year 3.75 more Duke Forests
2010 GHG Update - University • Trends • Campus electricity use going down • Duke Energy emissions factors lower than originally projected • Reduction of coal in steam production • People driving further for their commute but using more alternatives
Compared to CAP projections - University 9% below 2007 baseline 12.5% below Business as Usual • University emissions are going down since 2008 – 12% below BAU projections in 2010, Little higher than CAP target ~ 2%
Projections Compared to CAP - University Linear Projection to 2024
Emissions moving in the right direction Economic conditions have helped this trend 2010 data does not reflect full implementation of initial CAP recommendations East campus steam plant LEED + policy Energy conservation Transportation demand management efforts Duke Energy is still large unknown Thinking about how to best revise CAP projections based on updated information and still be able to measure progress GHG/CAP Update Summary
Next Steps • Additional GHG Inventory analysis • Review projected vs. actual financial impact • Further detailed analysis of specific measures and impact • Develop schedule for reviewing/revising CAP projections • Sustainability Strategic Plan • Building on CAP - Food, recycling/waste, green purchasing, water, land use • CSC focus next year on developing targets • Offsets
CARBON OFFSETS - First Offsets Project Operational May 2011: Duke University-Duke Energy Swine Waste-to-Energy Partnership Yadkin County system will capture methane and generate electricity on the order of ~5,000 CO2e tons and ~500,000 kWh (~500 MWh) of electricity annually; represents ~2.7% of Duke’s annual offsets needs System meets stringent environmental performance standards to substantially eliminate nutrients, ammonia, pathogens, odors and metals and stop discharge of waste to surface and groundwater Offsets Initiative seeing interest in replicating system; project considered model pilot by federal and state leaders Jet Aeration System for Nitrogen Treatment (April 13, 2011) Digester prior to cover installation (April 13, 2011)