Download

1 / 69
690 likes | 847 Views
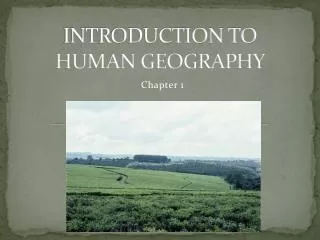
Chapter 1. Introduction to Human Geography. Map forms Choropleth maps

E N D
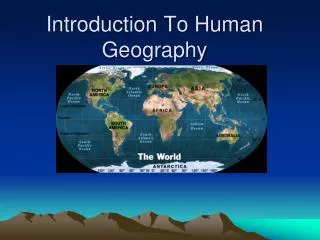
Chapter 1 Introduction to Human Geography
Map forms Choropleth maps These maps, where each spatial unit is filled with a uniform color or pattern. These types of maps are good for showing the dominance of a certain trait. Here is a definition I found on another website:Choropleth (colour shaded) maps. This is the most common type, and is especially appropriate for showing standardised data such as rates, densities or percentages. A different colour is used for each of a number of bands, allowing users to identify which areas have high, low or middling values. So if you want to know which area has a higher divorce rate versus areas that are less dominant with this trait. Choropleth is the best version to go with.
Isopleth maps Isopleth maps differ from choropleth maps in that the data is not aggregated to a pre-defined unit like a political area (ie a county or a state). These maps can take two forms: Lines of equal attribute value are drawn such that all values on one side are higher than the "isoline" value and all values on the other side are lower, or Ranges of similar attribute value are filled with similar colors or patterns. This type of map is used to represent continuous area data that varies smoothly over space. Temperature, for example, is a phenomenon that should be mapped using isoplething, since temperature exists at every point (is continuous), yet does not change abruptly at any point (like tax rates do as you cross into another political zone). Elevation maps should always be in isopleth form for this reason.
Simple Explanation: Isoline maps take an area that has one value and draws a line around it. For example if the temperature of Chicago's lakefront was 80 today then that area would have a line drawn around it. The area that went higher than 80 would be on the other side of that line. So each time you cross the line you are changing temperature. The lines are drawn to connect temperature zones. Isoline maps are often used for weather or elevation and each time you cross a line a number is going up or down (height, depth, temperature, etc)
Dot maps Used to represent themes that vary smoothly over space but are discrete, dot maps create a visual impression of density by placing a dot or some other symbol in the approximate location of one or more instances of the variable being mapped. Dot maps should be used only for raw data, not for data normalized or expressed as a ratio. Appropriate themes for dot maps include livestock farms, utility poles, and population distribution in a region.
Dot maps help to show patterns and go along with raw data. Let's say you are looking for where crimes occur and how best to deal with them. A dot map would show you if the crimes are occurring in alleys or in parking lots or on certain streets. Each dot on the map would be a precise location and the more dots, the more the crimes are occuring in that area. This helps you to understand where crimes are occuring and to see a pattern. So dot maps go with raw data and patterns.
Map Scale • What does map scale determine and how does it determine it?
Projection • The scientific method of transferring locations on Earth's surface to a flat map • What are the 4 key issues • Look at Goode's Atlas
http://www.kidsgeo.com/geography-for-kids/0031-map-projection-types.phphttp://www.kidsgeo.com/geography-for-kids/0031-map-projection-types.php
The Land Ordinance of 1785 was adopted by the United States Congress on May 20, 1785. Under the Articles of Confederation, Congress did not have the power to raise revenue by direct taxation of the inhabitants of the United States. Therefore, the immediate goal of the ordinance was to raise money through the sale of land in the largely unmapped territory west of the original colonies acquired from Britain at the end of the Revolutionary War. • The 1785 ordinance laid the foundations of land policy in the United States of America until passage of the Homestead Act in 1862. The Land Ordinance established the basis for the Public Land Survey System. The initial surveying was performed by Thomas Hutchins. After he died in 1789, responsibility for surveying was transferred to the Surveyor General. Land was to be systematically surveyed into square "townships", six miles (9.656 km) on a side. Each of these townships were sub-divided into thirty-six "sections" of one square mile (2.59 km²) or 640 acres. These sections could then be further subdivided for sale to settlers and land speculators. • The ordinance was also significant for establishing a mechanism for funding public education. Section 16 in each township was reserved for the maintenance of public schools. Many schools today are still located in section sixteen of their respective townships
Geographic information system • A geographic information system (GIS), or geographical information system, captures, stores, analyzes, manages, and presents data that is linked to location. • In the strictest sense, the term describes any information system that integrates, stores, edits, analyzes, shares, and displays geographic information. In a more generic sense, GIS applications are tools that allow users to create interactive queries (user created searches), analyze spatial information, edit data, maps, and present the results of all these operations. Geographic Information Science is the science underlying the geographic concepts, applications and systems, taught in degree and GIS Certificate programs at many universities.
GIS technology can be used for scientific investigations, resource management, asset management, archaeology, environmental impact assessment, urban planning, cartography, criminology, geographic history, marketing, logistics, Prospectivity Mapping, and other purposes. For example, GIS might allow emergency planners to easily calculate emergency response times in the event of a natural disaster, GIS might be used to find wetlands that need protection from pollution, or GIS can be used by a company to site a new business location to take advantage of a previously under-served market.
Map information in a GIS must be manipulated so that it registers, or fits, with information gathered from other maps. Before the digital data can be analyzed, they may have to undergo other manipulations—projection and coordinate conversions, for example—that integrate them into a GIS.
Geocoding is interpolating spatial locations (X,Y coordinates) from street addresses or any other spatially referenced data such as ZIP Codes, parcel lots and address locations. A reference theme is required to geocode individual addresses, such as a road centerline file with address ranges. The individual address locations are interpolated, or estimated, by examining address ranges along a road segment. These are usually provided in the form of a table or database.
Geostatistics is a point-pattern analysis that produces field predictions from data points. It is a way of looking at the statistical properties of those special data.
Remote sensing is the small or large-scale acquisition of information of an object or phenomenon, by the use of either recording or real-time sensing device(s) that is not in physical or intimate contact with the object (such as by way of aircraft, spacecraft, satellite, buoy, or ship). In practice, remote sensing is the stand-off collection through the use of a variety of devices for gathering information on a given object or area. Thus, Earth observation or weather satellite collection platforms, ocean and atmospheric observing weather buoy platforms, monitoring of a pregnancy via ultrasound, Magnetic Resonance Imaging (MRI), Positron Emission Tomography (PET), and space probes are all examples of remote sensing. In modern usage, the term generally refers to the use of imaging sensor technologies including but not limited to theuse of instruments aboard aircraft and spacecraft, and is distinct from other imaging-related fields such as medical imaging.
The Global Positioning System (GPS) is a global navigation satellite system (GNSS) developed by the United States Department of Defense and managed by the United States Air Force 50th Space Wing. It is the only fully functional GNSS in the world, can be used freely, and is often used by civilians for navigation purposes. It uses a constellation of between 24 and 32 medium Earth orbit satellites that transmit precise radiowave signals, which allow GPS receivers to determine their current location, the time, and their velocity. Its official name is NAVSTAR GPS. Although NAVSTAR is not an acronym,[1] a few backronyms have been created for it.[2] • Since it became fully operational in 1993, GPS has become a widely used aid to navigation worldwide, and a useful tool for map-making, land surveying, commerce, scientific uses, and hobbies such as geocaching.
What is Human Geography? Key Question:
Human Geography • The study of how people make places, how we organize space and society, how we interact with each other in places and across space, and how we make sense of others and ourselves in our locality, region, and world.
Why do Kenyans grow tea and coffee instead of cash crops? Geographers use fieldwork to understand linkages among places and to see the complexities of issues
A set of outcomes that are: unevenly distributed varying across scales differently manifested throughout the world. Globalization • A set of processes that are: • increasing interactions • deepening relationships • heightening interdependence without regard to country borders.
Imagine and describe the most remote place on Earth you can think of 100 years ago. Now, describe how globalization has changed this place and how the people there continue to shape the place – to make it the place it is today.
What are Geographic Questions? Key Question:
Geographic inquiry focuses on the spatial: • - the spatial arrangement of places • and phenomena (human and • physical). • - how are things organized on Earth? • - how do they appear on the landscape? • - why? where? so what?
Spatial distribution • What processes create and sustain the pattern of a distribution? Map of Cholera Victims in London’s Soho District in 1854. The patterns of victim’s homes and water pump locations helped uncover the source of the disease.
Five Themes of Geography • Location • Human-Environment • Region • Place • Movement
Place • Sense of place: infusing a place with meaning and emotion. • Perception of place: belief or understanding of what a place is like, often based on books, movies, stories, or pictures.
Perception of Place Where Pennsylvanian students prefer to live Where Californian students prefer to live
Spatial interaction: the interconnectedness between places depends upon: Distance Accessibility Connectivity Movement
The visible human imprint on the landscape. Cultural Landscape Religion and cremation practices diffuse with Hindu migrants from India to Kenya.
Sequent Occupance • Layers of imprints in a cultural landscape that reflect years of differing human activity. Athens, Greece ancient Agora surrounded by modern buildings
Sequent Occupance • Dar es Salaam, Tanzania • African, Arab, German, British, and Indian layers to the city. Apartment in Mumbai, India Apartment in Dar es Salaam, Tanzania
Geographers who practice fieldwork keep their eyes open to the world around them and through practice become adept at reading cultural landscapes. Take a walk around your campus or town and try reading the cultural landscape. Choose one thing in the landscape and ask yourself, “what is that and why is it there?” Take the time to find out the answers!
Why do Geographers use Maps, and What do Maps Tell Us? Key Question:
Thematic Maps Tell a story about the degree of an attribute, the pattern of its distribution, or its movement. Relative locations What are thematic maps used for? Two Types of Maps: • Reference Maps • Show locations of places and geographic features • Absolute locations What are reference maps used for?
Thematic Map What story about median income in the Washington, DC area is this map telling?
Mental Maps: • maps we carry in our minds of places we have been and places we have heard of. • can see: terra incognita, landmarks, paths, • and accessibility • Activity Spaces: • the places we travel to routinely in our rounds of daily activity. • How are activity spaces and mental maps related?
Geographic • Information • System: • a collection of • computer hardware • and software that • permits storage and • analysis of layers of • spatial data.
Remote Sensing:a method of collecting data by instruments that are physically distant from the area of study.
Give a friend or family member a blank piece of paper. Ask the person to draw a detailed map of how he or she gets from home to the place where most of his or her weekdays are spent (work, school). Note the age of the person and the length of time he or she has lived in the place and traveled the route. Analyze the map for terra incognita, landmarks, paths, and accessibility. What does the map reveal about the person’s lifestyle and activity space?