Download
1 / 26
260 likes | 328 Views
Interpreting and Using Existing Data to Identify Pollution Causes and Sources. Confirm impairments and identify pollutants. Compare available monitoring data to wqs: Document magnitude of impairment Document seasonal/temporal patterns Document spatial distribution. Spatial Analysis.

E N D
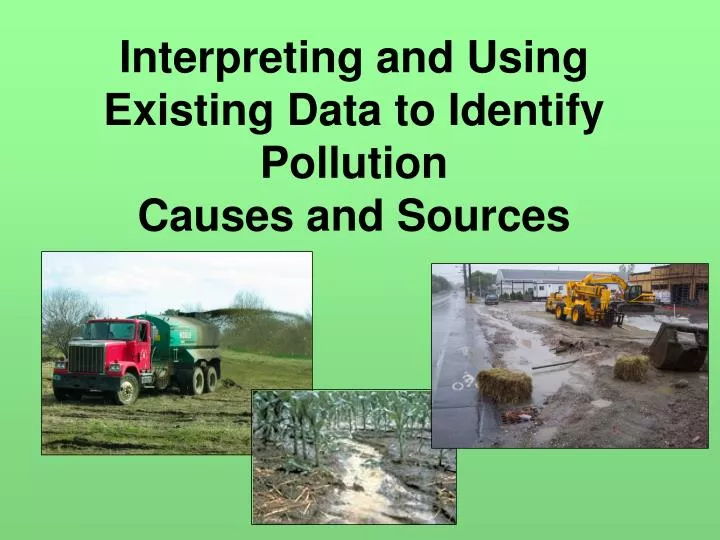
Interpreting and Using Existing Data to Identify Pollution Causes and Sources
Confirm impairments and identify pollutants • Compare available monitoring data to wqs: • Document magnitude of impairment • Document seasonal/temporal patterns • Document spatial distribution
Spatial Analysis • Isolate critical subwatersheds • Combine with land use/land cover data
Flow Relationships • Point vs. Nonpoint
Flow Relationships • Point vs. Nonpoint
Temporal Analysis • Seasonality • Stratify data by potential source activities • Tillage • Crop canopy development • Manure/fertilizer applications • Grazing season • Logging • Construction projects • Street cleaning
Other tools: • Stakeholder knowledge • Direct observation (streamwalk) • Specialized tools, e.g., microbial source tracking, ground water aging
Supplementing available data • Windshield surveys • Interviews with residents • Volunteer monitoring • Bioassessment • Targeted sampling • Chemical/biological sampling Helps lay the groundwork for implementation!
St. Albans Bay VT RCWP • Known WQ impairment due to eutrophication • Obvious algae blooms & macrophyte growth • Declining State Park visits, beach closures • State DEC P monitoring • Excessive P loads to Bay • 75% point source/25% nps • NRCS knowledge about current status of animal waste management, milkhouse waste, cropland erosion
Lake Pittsfield IL • Lake Pittsfield is a 220 ac lake located near the city of Pittsfield in the 25,393 ac Blue Creek watershed in Pike County, western Illinois • Constructed in1961 as a flood control reservoir. • Sediment deposition the dominant water quality problem
Lake Pittsfield IL • 1979 vegetative practices on agricultural land slowed sedimentation rate • Lake sedimentation still higher than desired • Additional practices needed – WASCOBs and sediment retention basins
Identification of stressors • Where causes of biological impairment are unknown, use characterization data to help identify stressors
Stressor Identification Resources: • USEPA Stressor Identification Guidance Document www.epa.gov/waterscience/biocriteria/stressors/stressors.html • USEPA Causal Analysis/Diagnosis Decision Information System (CADDIS) http://cfpub.epa.gov/caddis/home.cfm