Download

1 / 12
120 likes | 246 Views
This presentation is a classroom resource from Windows to the Universe with funding from the Center for Multi-Scale Modeling of Atmospheric Processes (CMMAP) and the National Center for Atmospheric Research (NCAR). Feeling the Heat. www.windows2universe.org.

E N D
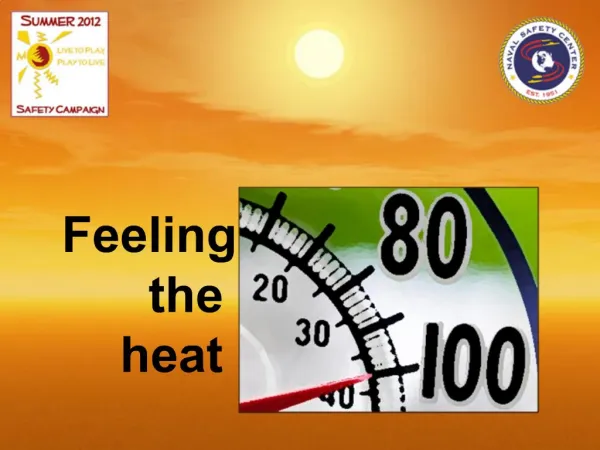
This presentation is a classroom resource from Windows to the Universe with funding from the Center for Multi-Scale Modeling of Atmospheric Processes (CMMAP) and the National Center for Atmospheric Research (NCAR). Feeling the Heat www.windows2universe.org
This presentation is full of data and images to get you thinking! Discuss as a class the patterns you see and the reasons for those patterns. Looking for patterns (slides 3 - 5) Take a look at graph representations of the Los Angeles heat wave data and the average temperature data. How have they changed through time? Reasons for patterns (slides 6 – 11) Check out how global climate has changed over time and compare that with the data from Los Angeles. Take a look at how Los Angeles has grown through time and how that has impacted the heat island effect. Feeling the heat
This graph shows the number of heat waves in Los Angeles, CA over the past century. Do you see a pattern? How have heat waves changed through time? (From Tamrazian et al., 2008) Looking for patterns
This graph shows the duration of heat waves in Los Angeles, CA (measured in days.) Has there been a change through time? (From Tamrazian et al., 2008) Looking for patterns
Courtesy of NOAA/NWS How has the temperature in Los Angeles changed over time? This graph shows the average temperature for each year. See a pattern? Looking for patterns
Warmer city temperatures are partially due to global warming. This graph shows how Earth’s average temperature has changed. Reasons for patterns
The highest temperatures are found in the most dense part of a city. That’s the urban heat island effect. The next 3 slides show how LA has changed over time. How do you think the heat island effect has changed as the city changed? Reasons for patterns
Los Angeles, CA in 1877. East LA is on the left and West LA is on the right. (Courtesy of the Library of Congress) Reasons for patterns
Los Angeles, CA in 1909. (Courtesy of the Library of Congress) Reasons for patterns
Los Angeles, CA in 2002.This 3-D perspective view was generated using topographic data and an enhanced color Landsat 5 satellite image mosaic. Topography is exaggerated one and one-half times. (Courtesy of NASA/JPL) Reasons for patterns
Population change in Los Angles since 1890. (Data from US Census Bureau) Reasons for patterns
For more information, please visit: www.windows2universe.org/teacher_resources/teach_heat.html Feeling the heat