Download

1 / 61
620 likes | 787 Views
Stormwater Management Planning & Design. Mike Novotney, P.E. (MD) Center for Watershed Protection Dave Briglio, P.E. MACTEC. Georgia Stormwater Management Manual. Hydrologic Methods & Analysis. Dave Briglio, P.E. MACTEC. biggest flows to consider. most destructive flows.

E N D
Stormwater Management Planning & Design Mike Novotney, P.E. (MD) Center for Watershed Protection Dave Briglio, P.E. MACTEC
Georgia Stormwater Management Manual Hydrologic Methods & Analysis Dave Briglio, P.E. MACTEC
biggest flows to consider most destructive flows Extreme Flood (Floodplain) Criteria OverbankFlooding Criteria most erosive flows Channel Protection Criteria most polluted flows Water Quality Criteria infiltrated flows Stormwater Better Site Design Bankfull Q critical
Unified Stormwater Sizing Criteria • Water Quality: Capture and treat runoff from first 1.2 inches of rainfall • Channel Protection: Provide extended detention of 1-yr, 24-hr storm over 24 hours • Overbank Flood Protection: Provide peak flow attenuation of 25-yr, 24-hr storm • Extreme Flood Protection: Manage 100-yr storm through detention or floodplain mgmt
CSS vs. GSMM… WQV Channel Flood Control Runoff Reduction Water Quality Aquatic Resource Protection Flood Control
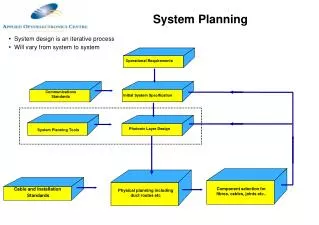
Runoff volumes and flow rates Water Balance Calculations Filtration/infiltration rates Design Support Determine Outlet Sizes Downstream analysis Design diversion structures Hydrologic design tasks
IDF Curves Rational Method SCS Method Curve numbers Peak flows Hydrographs Georgia Regression Peak flows Hydrographs Urban and Rural Water Balance Water Quality Calcs. Volumes Flow Rates Chapter 2.1
Storage volume calculations Channel protection volume Chapter 2.2 Chapter 2.3: outlet design
Statewide consistency Fitted to curves automated methods Chapter 2.1 - IDF Curves
SCS STORM 6 - HOUR STORM
SCS STORM The SCS storm is just an “average” balanced storm. 6 Hour Storm
From USGS Urban and Rural Different Regions Peak Flow Urban 25 ac. <A< 19 mi2 1% <TIA< 62% Hydrographs lag times Chapter 2.1- Regression Equations
Beware of odd situations that do not fit the “average” criteria: • odd shaped basins and lag time impacts • two basins versus one big one – peak timing • storage within the basin • “patchy” urban areas
Basic mass balance equation Localized for Georgia Very approximate Chapter 2.1 – Water Balance
P = precipitation * pond surface area Ro = runoff based on watershed efficiency Bf = baseflow, normally zero I = infiltration, either measured or estimated E = evaporation based on free surface map derived for Georgia Et = evapotranspiration, use free surface unless lots of emergent vegetation Of = pond overflow when ever pond exceeds capacity
Water quality volume calculation – volume based BMPs Peak discharge – flow based BMPs Chapter 2.1 - Water Quality
Water Quality Volume Calculation - 85% Rule WQv = (1.2 in) (Rv) (A)/12 where: WQv = water quality volume 1.2 = approx. 85th percentile storm Rv = 0.05 + 0.009(I) I = percent imperviousness A = site area
Water Quality Volume Calculation • Impervious cover can be taken directly off plans or estimated using TR-55 land use factors • WQv should be calculated and addressed separately for each drainage area on a development site • Off-site drainage areas can be excluded
Graphical method Based on extended detention – 24-hours Approximate but proven accurate Avoids iterative approaches Chapter 2.2 - Channel Protection
Channel Protection Volume Estimation Step 1- Compute Unit Peak Discharge • · Ia = 0.2S and S = (1000/CN) –10 • ·P = XX inches (1-year storm) from Tables Ia/P = 0.2S/P • ·Tc = developed conditions time-of-concentration ·qu = from figure 2.1.5-6 XX cubic feet per square mile per inch (csm/in)
Extended Detention Estimated Volume Step1: Knowing: Ia, P, Tc Read: qu p. 2.1-30
Extended Detention Estimated Volume Step2: Knowing: qu & T (drawdown time) Read: qo/qi (ratio of outflow to inflow) qo/qi = 12.03 qu –0.9406 p. 2.2-10
Extended Detention Estimated Volume Step3: Knowing:qo/qi (ratio of outflow to inflow) & Storm Type I or II Read: Vs/Vr (ratio of storage volume to runoff volume – Q in the SCS equation) Vs/Vr = 0.683 - 1.43(qo/qi) +1.64(qo/qi) 2 - 0.804(qo/qi)3 p. 2.2-10
Back out curve number Calculate unit peak discharge using SCS simplified peak figures Calculate peak discharge as: Ia=0.2S=1000/CN-10 WQ Peak Flow
Works for 25-year, 100-year, etc. Storm Volume: For: Know Qin and Qout = qo/qi p. 2.2-10 Read Vs/Vr Vr= runoff volume Then Vs= storage volume (af) For multiple outlets multiply Vs by safety factor of 1.15.
A few new things derived for this manual
Downstream Assessment Requirement The “poor man’s master plan”. Look downstream until the flow is small compared to the total flow Based on modeling numerous locations
Same peaks Different volumes Volume is the issue Post Pre Pond
No pond Point where pond controlled area is 10% of the total drainage area With pond Downstream Assessments use “10% Rule” Postdevelopment Q/Predevelopment Q Total Area/Pond Controlled Area
5 acres 40 acres 20 acres 60 acres 80 acres Example 1
Example 2 Big 25 acres
10% Rule Steps • Determine the 10% point • Determine pre-development flows to 10% point • Determine post-development flows to 10% point • Note any increases • Design detention for no increase or negotiate another solution • Flow easement • Downstream improvements • Regional solution
B 20 acres Tc=20 min CN = 75 5 acres A 15 acres Tc=20 min CN = 75 40 acres 20 acres C 20 acres Tc=15 min CN = 70 60 acres 80 acres Example 3
43 43
Advantages of Downstream Assessments • Fairly easy to accomplish • Protects from the liability of downstream impacts • Allows for potential waiver of detention • Stops unnecessary or harmful detention • Allows for “horse trading” • Cheaper than master planning • Do not use with extended detention design
Site Suitability Design Criteria Design Calculation Forms RRv Criteria Satisfaction CSS Design Credits Coastal Challenges Appendix Information Other CSS/GSMM Tools