Download
1 / 52
520 likes | 703 Views
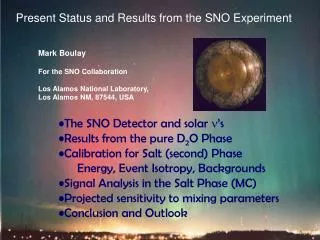
Results and Prospects for SNO. Low Energy Threshold Analysis (LETA) Motivations Analysis Details Results Status of `three-phase’ Analysis Summary and Other Recent Results. Josh Klein, for the SNO Collaboration University of Pennsylvania. 15 June 2010. Sudbury Neutrino Observatory.

E N D
Results and Prospects for SNO • Low Energy Threshold Analysis (LETA) • Motivations • Analysis Details • Results • Status of `three-phase’ Analysis • Summary and Other Recent Results Josh Klein, for the SNO Collaboration University of Pennsylvania 15 June 2010
Sudbury Neutrino Observatory Neutrino-Electron Scattering (ES) Neutral Current (NC) • neutrino reactions on deuterons National Geographic Charged Current (CC) Signal rates determined by statistical fit
Three Phases of SNO • Phase I: Just D2O • Simple detector configuration, clean measurement • Low neutron sensitivity • Poor discrimination between neutrons and electrons • Phase II: D2O + NaCl • Very good neutron sensitivity • Better neutron electron separation • Phase III: D2O + 3He Proportional Counters • Good neutron sensitivity • Great neutron/electron separation
Low Energy Threshold Analysis • Motivations: ne Statistics CC En=6 MeV ES En=6 MeV Night Day
Low Energy Threshold Analysis +74% +68% • Motivations: NC Precision nx (NC) Statistics Breaking NC/CC Covariance Phase I (D2O) NC I “Beam Off” Low n capture eff. Phase II (D2O+NaCl) NC II “Beam On” Highn capture eff.
Low Energy Threshold Analysis • Overview Key components: Joint-Phase (I+II) fit for all signals and remaining bkds Reduction of Backgrounds Reduction of Systematic Uncertainties `Float’ Dominant Uncertainties in Fit Needed to rework SNO’s entire analysis chain and simulation, from measurement of charge pedestals to final fit methods. Results: • 8B flux measured by NC rates • Bin-by-bin electron energy spectrum using CC & ES • Parameterized Psurv(En) (New) • Two-flavor and three-flavor extraction of mixing params.
Low Energy Threshold Analysis • Signal Extraction Fit (Signal PDFs) Monte Carlo Not used (unconstrained in fit) Teff (MeV) cosqsun (R/RAV)3 Isotropy = 1-D projections of 3-D and 4-D PDFS
Low Energy Threshold Analysis • Low Energy Backgrounds Cosmic rays < 3/hour Teff>3.5 MeV All events ( but only ~5000 ns) D2O Acrylic Vessel H2O }×{ 214Bi (U, Rn) 208Tl (Th) + (most backgrounds constrained by ex-situ radioassays) + PMT 208Tl Acrylic Vessel Surface Neutrons [(α,n) reactions] + 24Na (neutron activation of salt) = 12 external bkds + 5 internal bkds For each phase
Low Energy Threshold Analysis • Low Energy Backgrounds Kinetic Energy Spectrum 3 neutrino signals + 17 backgrounds PMT b-gs MC Old threshold NC+CC+ES (Phase II) internal (D2O) external (AV + H2O) New Threshold = 3.5 MeV
Low Energy Threshold Analysis • Signal Extraction Fit (3 out of 17(x2)Background PDFs) Monte Carlo Teff (MeV) cosqsun (R/RAV)3 Isotropy = 1-D projections of 3-D and 4-D PDFS
Low Energy Threshold Analysis Late Timing Cut Prompt Timing Cut Time Residual (ns) • Background Reduction: Energy Resolution Rayleigh Scatter (used in prior analyses) Using all hits increased hit statistics by ~12% ->6% reduction in resolution ~60% reduction internal bkds `Prompt’ (direct) light easy to model: we know the path traveled
Low Energy Threshold Analysis • Background Reduction: New Cuts Only information is PMT charges, times, and hit patterns • 4 KS tests of PMT pattern against single Cherenkov e- • 1 KS test of PMT times against Cherenkov e- • 3 cuts on various isotropy parameters • 2 cuts on energy reconstruction uncertainty • In-time ratio vs. Nhitto remove misreconstructed events
Low Energy Threshold Analysis • Background Reduction: New Cuts • `Early’ Charge to cut PMT b-gs High charge early in time Fiducial Volume γ β β Note: This would have been impossible if we hadn’t fixed `little’ things like charge pedestals
Low Energy Threshold Analysis • Special Case: PMT b-gPDFs Not enough CPUs to simulate sample of events Use data instead PassFail Early charge probability Early charge probability PassPass FailFail FailPass In-time ratio In-time ratio `Bifurcated’ analysis NPF= e1(1-e2)Nb NFP = (1-e1) e2Nb NFF = (1-e1)(1-e2)Nb NPP = e1e2Nb + Ns NPMT= NPP – Ns = NFP * NPF / NFF
Low Energy Threshold Analysis • Systematic Uncertainties: Brief Summary 0% 1% 2% 3% 4% I n capture LETA I II LETA II Teff scale I=D2O II=D2O+Salt N/A b14 (isotropy) Fiducial volume
Low Energy Threshold Analysis • Systematic Uncertainties
Low Energy Threshold Analysis • Tests of PDF shapes Comparison of 208Tl calibration source data to MC Run near the AV (to model AV 208Tl events)
Low Energy Threshold Analysis • Tests of PDF shapes Distributed Rn Spike Fit to spike energy spectrum allowing Teff scale to float: shift is 0±0.6%
Low Energy Threshold Analysis • Signal Extraction Fit (3 signals+17 backgrounds)x2, and pdfs are multidimensional: ES, CC NC, backgrounds Two distinct methods: • 1.Maximum likelihood with binned pdfs: • Manual scan of likelihood space • Data helps constrain systematics • `human intensive’ • 2. Kernel estimation---ML with unbinnedpdfs: • Allows full `floating’ of systematics, incl. resolutions • CPU intensive---use graphics card!
Low Energy Threshold Analysis • Fit Results: Binned fit, 1D Projections
Low Energy Threshold Analysis • 8B Flux Results with `unconstrained’ CC spectrum LETA A LETA B
Low Energy Threshold Analysis • `Unconstrained’ CC Electron Spectrum
Low Energy Threshold Analysis • `Unconstrained’ CC Electron Spectrum Flat:2 = 21.52/15 d.o.f.
Low Energy Threshold Analysis • Direct fit to data for Psurv(En) Parameterize distortion to ne spectrum with quadratic Psurvis independent of any flux model: CC and ES rates constrained to be less than NC This helps separate signals and backgrounds: PDFs are now 4D PeeDAY(E) = c0 + c1 (E - 10 MeV) + c2 (E - 10 MeV)2 PeeASYM(E) = a0 + a1 (E - 10 MeV) PeeNIGHT(E) = PeeDAY(E) x [1 + (1/2)*PeeASYM(E)] [1 – (1/2)*PeeASYM(E)] Note: Fit is now in En, not Teff
Direct Fit for Energy-Dependent Survival Probability Previous global best-fit LMA point: tan212 = 0.468, m2 = 7.59x10⁻⁵ eV2 8B = 5.046 +3.8 -3.9 % No distortion, noD/N: 2 = 1.94 / 4 d.o.f. LMA-prediction: 2 = 3.90 / 4 d.o.f. DAY NIGHT ASYM
Comparisons of 8B Spectra J.L. Raaf, Boston University SNO Day Night Borexino arXiv:0808.2868v2
Oscillation Analyses:SNO Only LETA paper 2009: LETA joint-phase fit + Phase III (3He) Best-fitpoint: tan212=0.437±0.058 m2=1.15x10⁻⁷+0.438-0.18 eV2 (LOW) SNO Collaboration, Phys. Rev C81, 55504
Solar + KamLAND 2-flavor Overlay • Brief History KamLANDCollab, Phys.Rev.Lett.90:021802,2003.
Solar + KamLAND 2-flavor Overlay • Brief History KamLAND collaboration
Solar + KamLAND 2-flavor Overlay • Brief History S. Abe et al. (KamLAND Collaboration), PRL 100, 221803 (2008)
Solar + KamLAND 2-flavor Overlay • Brief History LETA paper 2009: LETA joint-phase fit + Phase III + all solar expts + KamLAND
Solar + KamLAND 2-flavor Overlay LETA paper 2009: LETA joint-phase fit + Phase III + all solar expts + KamLAND 2-flavor overlay 2 model
Oscillation Analyses: Solar + KamLAND LETA paper 2009: LETA joint-phase fit + Phase III + all solar expts + KamLAND Best-fit LMA point: tan212 = 0.457+0.040-0.029 (q12=34.06+1.16-0.84 deg) sin2q12-1/3=-0.02+0.016-0.018 m2 = 7.59x10⁻⁵ eV2 (+0.20 -0.21) 2 model 8Buncert = +2.38 -2.95 %
Solar + KamLAND 3-flavor Overlay LETA paper 2009: LETA joint-phase fit + Phase III + all solar expts + KamLAND 3-flavor fit/overlay ->Pointed out by many authors Best-fit: sin213=2.00 +2.09-1.63 x10⁻² sin213 < 0.057 (95% C.L.) 3 model
``Three-Phase’’ Analysis • Combine LETA+Phase III (3He) in single fit • Pulse Shape Analysis to separate 3He signal from background • Constrain 3-phase fit using 3He neutron count • Output is 8B flux using NC + Psurv(En) +
``Three-Phase’’ Analysis • Pulse Shape Analysis Two 2-D Cuts: Hypothesis Test 1 Hypothesis Test 2 Fit to counter pulse energy spectrum used to constrain number of neutrons in full fit See poster by R. Martin, N. Oblath, N. Tolich
``Three-Phase’’ Analysis • Pulse Shape Analysis All phases combined with Psurv(En) fit Expected Dm2 improvement Also: expect to bring limits on hep down by x2 See poster by P-L. Drouin, C. Howard, N. Barros
Other SNO Results Low-multiplicity burst search High frequency periodicity search Expected Sensitivity Neutrons and spallation products See poster by A. Anthony, ApJ. 710:540-548 See poster by J. Loach
Summary • LETA analysis improved precision on NC by more than factor of 2. • Lowest analysis threshold yet achieved by water Cherenkov technique • Low E spectrum (still) consistent with no distortion • First model-independent fit for solar nesurvival probability • 3-flavor analysis shows non-zero q13 but consistent with q13=0: • Expect further improvement with 3-phase analysis • Just a few other things left to do… sin213=2.00 +2.09-1.63 x10⁻² sin213 < 0.057 (95% C.L.)
Systematic Uncertainties • Position Old New Central runs remove source positioning offsets, MC upgrades reduce shifts Fiducial volume uncertainties (> factor of 3 improvement: Old: Phase I ~ ±3% Phase II ~ ±3% New: Phase I ~ ±1% Phase II ~ ±0.6% Tested with: neutron captures, 8Li, outside-signal-box ns
Systematic Uncertainties • Isotropy (b14) MC simulation upgrades provide biggest source of improvement Tests with muon `followers’, Am-Be source, Rn spike b14 Scale uncertainties (factor of 2 improvement): Old: Phase I --- , Phase II = ±0.85% electrons, ±0.48% neutrons New: Phase I ±0.42%, Phase II =±0.24% electrons,+0.38%-0.22% neutrons
8B Flux Result NC = 5.140 +4.0 -3.8 % J. N. Bahcall, A. M. Serenelli, and S. Basu, AstroPhys. J. 621, L85 (2005)
Monte Carlo Upgrades • Calibrations Parameters for simulation measured and tested with sources • Laser source (optics/timing) • 16N6.13 MeV’s • Radon `spikes’ • Neutrons 6.25 MeV’s • pT19.8 MeV’s • 8Li ’s, E<14 MeV • Encapsulated U and Thsources
Systematic Uncertainties • Energy Scale No correction With correction 16N calibration source 6.13 MeVgs Volume-weighted uncertainties: Old: Phase I = ±1.2% Phase II = ±1.1% New: Phase I = ±0.6% Phase II = ±0.5% (about half Phase-correlated) Tested with: Independent 16N data, n capture events, Rn `spike’ events…
New Cuts ~80% reduction in external bkds • Summary
Direct Fit for Energy-Dependent Survival Probability Previous global best-fit LMA point: tan212 = 0.468, m2 = 7.59x10⁻⁵ eV2 NIGHT DAY
Survival Probability DAY NIGHT
Survival Probability DAY NIGHT
Survival Probability DAY NIGHT