Download
1 / 61
610 likes | 698 Views
Washington State Low Income Weatherization Program Evaluation Calendar Year 2011 DRAFT Results. Prepared by: Rick Kunkle July 2013. Purpose of Evaluation. Identify and document Weatherization Program outcomes, benefits and costs to: Assure prudent use of funds (accountability)

E N D
Washington State Low Income Weatherization Program Evaluation Calendar Year 2011DRAFT Results Prepared by: Rick Kunkle July 2013
Purpose of Evaluation • Identify and document Weatherization Program outcomes, benefits and costs to: • Assure prudent use of funds (accountability) • Improve the quality and effectiveness of program services • Assess progress toward Weatherization Program outcomes as measured by key performance measures
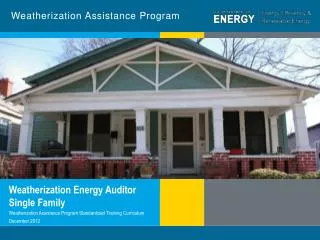
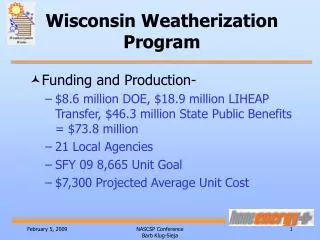
Weatherization Program Overview • Serves low income families by installing energy efficiency measures and making health and safety improvements and necessary repairs • Services provided in Washington since 1977 • Managed by the Housing Improvement and Preservation Unit in the Department of Commerce • Commerce contracts with 28 local agencies to deliver services • Funded by a mix of state and local sources • The American Recovery and Reinvestment Act (ARRA) significantly increased funding, primarily in 2010 and 2011
Previous Evaluation Findings • Oak Ridge National Laboratory completed an impact evaluation for Washington in 2001 showing energy savings compared favorably with other states • WSU Energy Program completed Washington evaluations for 2006 and FY2010 • Benefits exceeded costs • Production increased significantly in FY2010 from ARRA funding • Recommendations for improving data collection, estimates of benefits, and cost tracking and allocation • Commerce has made investments and progress in addressing evaluation recommendations
Evaluation Approach • The evaluation covers calendar year 2011 • Project Data: from the Weatherization information Data System (WIDS) for projects with final inspections in 2011 • Program Data: from Commerce including expenditures, agency work plans, and historical data
Bottom Line Results for 2011 • Expenditures were $48 million. This is more than twice 2005-2008 annual expenditures. Over half was from ARRA • Production was 7,451 units. This is a little less than the peak in 2010, but still more than twice pre-ARRA production. Two-thirds of production was multi-family units • Over 12,000 people lived in housing that was weatherized • On average, 9 improvement measures were installed in each weatherized unit • Estimated energy savings is $1.17 million/year. On average this is $157/unit. Other benefits are estimated to be $198/unit • The Program benefit-cost ratio is estimated to be 1.12, meaning that benefits slightly exceed costs
What is in this Presentation • Program Delivery • Program Benefits • Program Costs • Program Cost-Effectiveness • Summary and Recommendations
Agency Service Delivery # of agencies % of FY10 production Type of Agency Delivery Method
Accomplishments, Challenges, Recommendations • Each year, local agencies produce a work plan that summarizes their processes, procedures, accomplishments, and challenges • Accomplishments: • Energy savings, comfort, health and safety and housing repair benefits of their weatherization work • Partnerships, cooperation and referrals • Challenges • Decreasing funding along with increasing costs from wage and other requirements (reporting, monitoring, training, etc.) • Recommendations • Clearer communication and more transparent decision-making about funding availability and allocations • Streamlining program requirements
Quality Assurance Inspections Specifications Correction Factor
Energy Savings Analysis in WIDS • Deemed savings estimates: • Developed savings coefficients by measure, building type, fuel source, and heating zone • Used savings coefficients with measure data in WIDs in savings calculations for each measure • Accounted for interactions between measures that save heating energy • Energy savings are calculated for each weatherization project with caps and checks • Energy cost savings based on average Washington energy costs by fuel source • Energy benefits calculations use weighted average measure life – 34 years
Total Energy Savings Fuel Source Building Type
Total Energy Savings by Measure Category Measure
Energy Cost Savings Fuel Source Building Type
Other Benefits Calculations • This is the same approach used for the FY2010 Evaluation • Utility benefits > estimated from best practices review • Reduce delinquent bills and bad debt write-off • Service shut offs and reconnects • Participant benefits > estimated from best practices review • Water/wastewater savings • Increased property value • Fewer moves • Health, safety and comfort benefits • Societal benefits • Reduce greenhouse gas and pollutant emissions > directly estimated • Improvements to the economy > estimated from evaluation of Weatherization Program for Pacific Power
Why are per unit costs higher in 2011 compared to FY2010? • Many of the reasons could be associated with ARRA • More comprehensive weatherization • Wage requirements • Reporting requirements • Quality assurance requirements • Others?