Download
1 / 31
340 likes | 554 Views
Oceanic Plotting. Procedures and Standards. …Why do I care? 1200 Oceanic Flights/day 33 GNEs/year (2006) (Caught in the Act) How Many More Corrected w/out Knowledge 8 Total AMC Oceanic Incidents (25%) (2005) Numerous other “ATC saves”

E N D
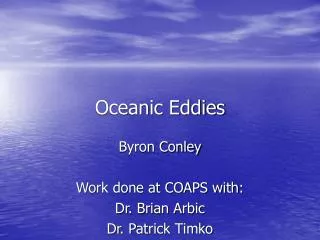
Oceanic Plotting Procedures and Standards
…Why do I care? • 1200 Oceanic Flights/day • 33 GNEs/year (2006) (Caught in the Act) • How Many More Corrected w/out Knowledge • 8 Total AMC Oceanic Incidents (25%) (2005) • Numerous other “ATC saves” • DoD responsible for 25% of GNEs w/ only 4% of oceanic flights (North Atlantic) • 90% of GNEs are pilot error
Oceanic Plotting • Pre-Mission • Pre-Flight • Inflight • After Landing
Pre-Mission • Check paperwork for accuracy and most current winding on Form 200 “Master Copy” • Extract the “block 10” fuel, and check weather, NOTAMS (NAT, PACOTS, L NOTAMS, etc) • Plot route on oceanic chart to include coast out, coast in fixes, mission #, A/C name, preparer’s name, and date
Pre-mission (cont.) • Calculate Equal Time Points (ETP) and annotate them on the chart • Use nearest suitable airfields and calculate the ETPs using the formula below: • ETP (in NM) = T x GS return GS return + GS continue T = Total route distance between suitable airfields GS return = Groundspeed returning to a suitable landing field GS continue = Groundspeed continuing to destination (or divert) field *NOTE – It is recommended that more than one ETP is computed to include a couple at 10,000 feet in the case of cabin decompression
Determine ETP Given: 1713 435 464
1713 1713 X 406 406 + 464 435 464
1713 1713 X 406 406 + 464 799 NM 435 464
Preflight • Record and compare actual ramp fuel on Form 200 “Master copy” • If actual and IFM RRFL differ, fill out a copy of “Mobility for the 21st Century Aircrew Survey” https://tacc.scott.af.mil/taccapps/surveysays/surveyquestions.asp?=1 and annotate both actual and IFM fuel loads on the AF Form 3578, “Tanker Activity Report”
Oceanic Crossing • Form 200 “Master Copy” annotations • Standardized oceanic chart plotting
Form 200 “Master Copy” • Once above a sterile altitude, a manual ETA (Estimated Time of Arrival) to the destination should be calculated and annotated onto the Form 200 “Master Copy” • ( O ) a circle shall be placed around a point when a second crewmember has independently verified the coordinates entered or crosschecked by the first crewmember • ( √ ) a check mark shall be placed before the point once it’s track and distance has been confirmed (track shall be within 2º and the distance shall be within 2 NM) • ( / ) a diagonal shall be placed over the circle once the coordinates of the approaching and next way point have been confirmed • (X) an X shall be placed over the circle when the point is passed • Annotations required: • ATA (Actual Time of Arrival) for the point • Fuel remaining • Winds • ETA (Estimated Time of Arrival) for the next point
Check Track ,Distance and Record ETA 0013 +/- 2 degrees +/- 2 NM *NOTE: ETA told to ATC must be updated if actual will be off by more than three minutes
Crossing the Fix, Annotate: ATA and Fuel – then Mark with an “X” 0013 0014 70 K
Chart Plotting: • Perform a gross error check with an available NAVAID and annotate the position and time • Upon reaching a waypoint, recheck position with FMS then plot the time and winds • 10 minutes after passing an oceanic point, crews should plot the point and annotate: • Latitude, Longitude, and Time
When Crossing a Point, Annotate: Time and Winds 0100Z 275/54 0100Z 275/54
10 Minutes After Crossing an Oceanic Point, Plot and Annotate: Time and Lat/Long 0110Z N55’03 W47’30 0100Z 275/54
After Landing • Return completed command flight logs (CFPs), IMT packages, plotting charts and surveys with mission paperwork for mission review • OGV will conduct mission review for all oceanic missions. • After mission review, packages will be stored in the OSO file plan for 3 months
Conclusion • Oceanic Plotting and Annotations • Pre-Mission • Pre-Flight • Inflight • After Landing