Download
1 / 44
440 likes | 624 Views
Introduction to Protein Informatics Bioe144, Fall 2009 Lecture 1, part 2 Kimmen Sjölander. Estimating phylogenetic trees using molecular data: nucleic acid data are best for close relationships (such as here), but amino acid data are best for distant relationships. What is homology?.

E N D
Introduction to Protein InformaticsBioe144, Fall 2009Lecture 1, part 2Kimmen Sjölander
Estimating phylogenetic trees using molecular data: nucleic acid data are best for close relationships (such as here), but amino acid data are best for distant relationships
What is homology? • Homology -> same form • Homology between two genes means “related by evolution, has a common ancestor”
Sequence similarity and evolutionary relationship • If two proteins have significant sequence similarity, they are related by evolution • It is not generally correct to say that two proteins are 50% homologous • However, 50% identity supports an assertion of homology • The converse is not true: two proteins can have undetectable sequence similarity but still be related by evolution • Questions: • What level of sequence similarity is significant? • If two sequences have undetectable sequence similarity, how can we determine if they are related?
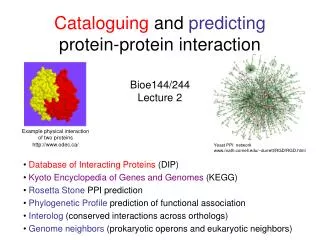
Antimicrobial Protein 1 Common horse chestnut Structural analysis reveals the common ancestry of plant and insect defensins 1BK8 1MYN Drosomycin, Antifungal protein Fruit Fly Only 22% Pairwise Identity (in the Twilight Zone) but structural and functional analyses support a common ancestry
Fundamental mechanisms underlying evolution of gene families Creighton, Proteins
Canonical example of gene family evolution and subsequent (tissue and temporal) subfunctionalization Creighton, Proteins
Proteins are composed of modular structural domains which are found in different domain architectures Leucine-Rich Repeat (LRR) Toll-Interleukin Receptor (TIR) domain Plant and animal innate immune systems are composed of molecules having a common evolutionary origin
G-protein-coupled receptors (GPCRs) This family displays both divergent and parallel evolution
Convergent evolutionFunctional similarity (and identical active sites)but structural dissimilarity supports an assertion that they do not share a common ancestor Subtilisin structure (1SBT A): One beta sheet surrounded by helices (primarily helical) Trypsin structure (3TGI E): Two beta barrels with two tiny helices (primarily beta)
Structure analysis suggests convergent evolution of these peptidases
1BK8 Antimicrobial Protein 1 (Ah-Amp1) Common horse chestnut Proteins can diverge structurally and functionally from a common ancestor 1AGT Agitoxin 2 Egyptian Scorpion (K+ channel inhibitor) Drosomycin, Antifungal protein Fruit Fly 1CN2 Toxin 2 Mexican scorpion (Na+ channel inhibitor) 1AYJ Antifungal protein 1 (RS-AFP1) Radish
Sequence and structural divergence are related “The relation between the divergence of sequence and structure in proteins”, Chothia and Lesk. EMBO Journal 1986
Most alignment methods perform poorly when sequences are evolutionarily distant
Gene duplication produces protein superfamilies including paralogs with divergent functions
Percolation of annotation errors Domain shuffling Neofunctionalization stemming from gene duplication Homology-based functional annotations are fraught with systematic error Two key statistics: Up to 25% of sequences may be mis-annotated* Fewer than 3% of sequences have experimental support for their annotated function *Brenner, SE "Errors in Genome Annotation" Trends Genet. 1999 Brown & Sjölander, "Functional Classification using Phylogenomic Inference." PLoS Computational Biology, 2006 Gilks et al, “Modeling the percolation of annotation errors in a database of protein sequences” Bioinformatics 2002 Galperin and Koonin "Sources of Systematic Error in Functional Annotation of Genomes" In Silico Biology. 1998
Definitions • Divergent evolution: related from a common ancestor • Homolog: related by divergent evolution • Ortholog: related by speciation from a common ancestor • Paralog: related by duplication from a common ancestor • Xenolog: acquired by HGT (horizontal gene transfer) • Parallel evolution: within a family of divergently related genes, two (or more) genes can acquire similar functional specificities • Example: GPCRs (e.g., serotonin and dopamine receptors) • Convergent evolution: no common ancestor, but the two genes have acquired a similar function • Example, chymotrypsin and subtilisin • Some relationships are uncertain • Example: TIM barrel proteins
Homologs: orthologs and paralogs Ancestral gene Homologs: genes that have descended from a common ancestral gene. Gene 1 Gene2 Paralogs: the last evolutionary event separating the genes was duplication. D Orthologs: the last evolutionary event separating the genes was speciation. S Courtesy of Nir Yosef
Orthology prediction using trees S Super-orthologs Orthology: the MRCA must correspond to a speciation event. (By this definition, the Yeast sequence is orthologous to all sequences in this example.) Super-orthology is more restrictive than orthology: all nodes on a path between two leaves must correspond to a speciation event. (Zmasek & Eddy, 2002) D H1 C1 M1 R1 F1 W1 H2 C2 M2 R2 F2 W2 Yeast Human, Chimp, Mouse, Rat, Fly, Worm
Why is orthology important? Reconstructing the Tree of Life PPI prediction (using interlog analysis) Phylogenomic inference of protein function Phylogenetic profile construction Prediction of biological pathways and network alignment
Ortholog prediction accuracy Assessed vs TreeFam-A manually curated orthologs Dataset: 100 (non-homologous) human sequences from TreeFam-A, filtered to remove homologs. PHOG-O: Standard orthology definition PHOG-S: Super-orthologs (Zmasek & Eddy) PHOG-T: thresholded PHOGs PHOG-T(M); optimized for mouse PHOG-T(Z): optimized for zebrafish PHOG-T(F): optimized for fruit fly
Proteins interact with other molecules(bioinformatics methods exist to predict these interactions) Yeast network, taken from “Form follows function: the architecture of complex networks” Molecular Systems Biology 2:42, 2006
Example bioinformatics analysis of inorganic pyrophosphatase
Fasta format sequence of human inorganic pyrophosphatase 2, mitochondrial >sp|Q9H2U2|IPYR2_HUMAN Inorganic pyrophosphatase 2, mitochondrial MSALLRLLRTGAPAAACLRLGTSAGTGSRRAMALYHTEERGQPCSQNYRLFFKNVTGHYI SPFHDIPLKVNSKEENGIPMKKARNDEYENLFNMIVEIPRWTNAKMEIATKEPMNPIKQY VKDGKLRYVANIFPYKGYIWNYGTLPQTWEDPHEKDKSTNCFGDNDPIDVCEIGSKILSC GEVIHVKILGILALIDEGETDWKLIAINANDPEASKFHDIDDVKKFKPGYLEATLNWFRL YKVPDGKPENQFAFNGEFKNKAFALEVIKSTHQCWKALLMKKCNGGAINCTNVQISDSPF RCTQEEARSLVESVSSSPNKESNEEEQVWHFLGK
Top BLAST matches, ordered by E-value Note that because we searched SwissProt, we are missing many homologs (e.g., chimp)
Chimp ortholog (from a separate BLAST search against the Chimp genome)
Iterated homology search followed by phylogenetic analysis shows universal conservation of this gene family bpg032120
Key terms and concepts • Divergent vs convergent evolution • Parallel evolution • Homology • Adaptation • Phylogenetic distribution • Tree of Life • Horizontal gene transfer • Speciation • Gene duplication • Selection • Twilight Zone • Domain fusion and fission events • Domain architecture • Gene loss & expansion Evolution conserves form & function, but also generates novel forms and functions. Similarity in sequence is evidence of evolutionary pressure to conserve structure and/or function