Download
1 / 25
250 likes | 258 Views
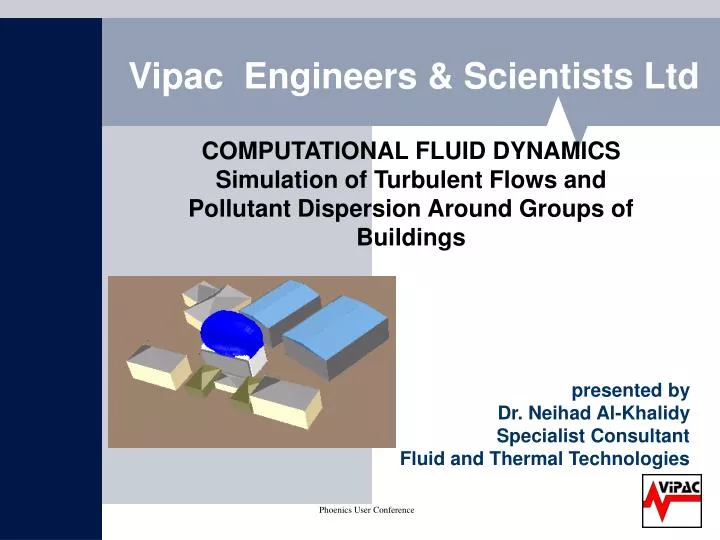
Vipac Engineers & Scientists Ltd. COMPUTATIONAL FLUID DYNAMICS Simulation of Turbulent Flows and Pollutant Dispersion Around Groups of Buildings . presented by Dr. Neihad Al-Khalidy Specialist Consultant Fluid and Thermal Technologies. Background .

E N D
Vipac Engineers & Scientists Ltd COMPUTATIONAL FLUID DYNAMICSSimulation of Turbulent Flows and Pollutant Dispersion Around Groups of Buildings presented by Dr. Neihad Al-Khalidy Specialist Consultant Fluid and Thermal Technologies
Background • The analysis of flow and dispersion of pollutants around buildings is important from an environmental point of view • Examine pollutant problem under different scenarios based on a detailed fluid flow Analysis
Strategy CFD Model Construction Wind data Data Flow Simulation Pollutant Dispersion Prediction Pollutant sources Probability Analysis Recommend modifications to the duct heights, dimensions or velocities to achieve the recommended criteria Compliance with Occupational Health & Safety Commission limits at human height levels and living area
Boundary Condition - Wind Data • Still wind condition • Windy condition • At the upwind free boundary inlet velocity profiles were derived from the Australian Wind Code AS1170.2
Boundary Condition - pollutant Data • The maximum pollution emission rate at each stack is 450 l/s • The maximum mass flowrate of Xylene fume is 1200 l/s at each of the two ducts through the roof located near the plant room • A pollution concentration of unity is assumed at the pollutant sources • The pollutants were assumed to be slightly heavier than air at the sources
CFD Modelling • Phonics Software • Navier-Stokes equations for continuity, momentum, energy and species concentration • Steady-state • Incompressible
CFD Modelling • Standard K-є model • 680000 unstructured grid cells • A Hybrid numerical approach to discretise the convective term in the governing equations. • SIMPLE algorithm for the pressure – velocity coupling. • Relaxation parameter to stabilize the solution processes • convergence 20-32 hours CPU
CFD Flow Results South-Westerly Wind Conditions
CFD Flow Results South-Westerly Wind Conditions
CFD Pollutant Dispersion Results • concentration profile in a horizontal section at the chest level. • Downwash effect
CFD Pollutant Dispersion Results • concentration profiles in a horizontal section at the 15 m elevation • Thepollutant dispersed to a wider region andthe concentration is increased to 1.7% source concentration.
CFD Pollutant Dispersion Results • concentration profiles in a horizontal section Through the outlet of the stack • The pollution concentrations seen to increase to 3% source concentration near the roof of the building.
CFD Pollutant Dispersion Results • Concentration Profile- Iso-surface of 1%Source Concentration – Pollutant Slightly Heavier Than Air
CFD Pollutant Dispersion Results • Concentration Profile- Iso-surface of 1%Source Concentration – Pollutant of a Similar Density Than That of Air Was Used
CFD Flow Results North-Easterly Wind Conditions
CFD Pollutant Dispersion Results • Concentration Profile in Horizontal Section at 1.5 m Elevation
CFD Pollutant Dispersion Results • Concentration Profile in Horizontal Section at 15 m Elevation
CFD Pollutant Dispersion Results • North-Easterly Wind Condition
CFD Pollutant Dispersion Results • Calm Wind Condition – near the roof of the building
Conclusions • ð Flow fields and pollutant dispersal around a number of buildings to the east and west of a proposed building have been predicted using computational fluid dynamics analysis. • ð The flow characteristics are seen to be captured well by the two equation k-ε model. The pollutant concentrations were predicted at the chest level and at a range of elevations during near calm wind and windy conditions. • ðThe CFD analysis has offered a comprehensive range of outputincluding velocity distribution, pressure profile and turbulence levels. Subsequent testing of the modified duct system has validated the approach using CFD analytical tools. • ð The CFD results will be validated against the measurement data when the proposed building is completed and operated
Vipac Engineers & Scientists Ltd • Phone: 1300 7 VIPAC • www.vipac.com.au