Download
1 / 1
10 likes | 105 Views
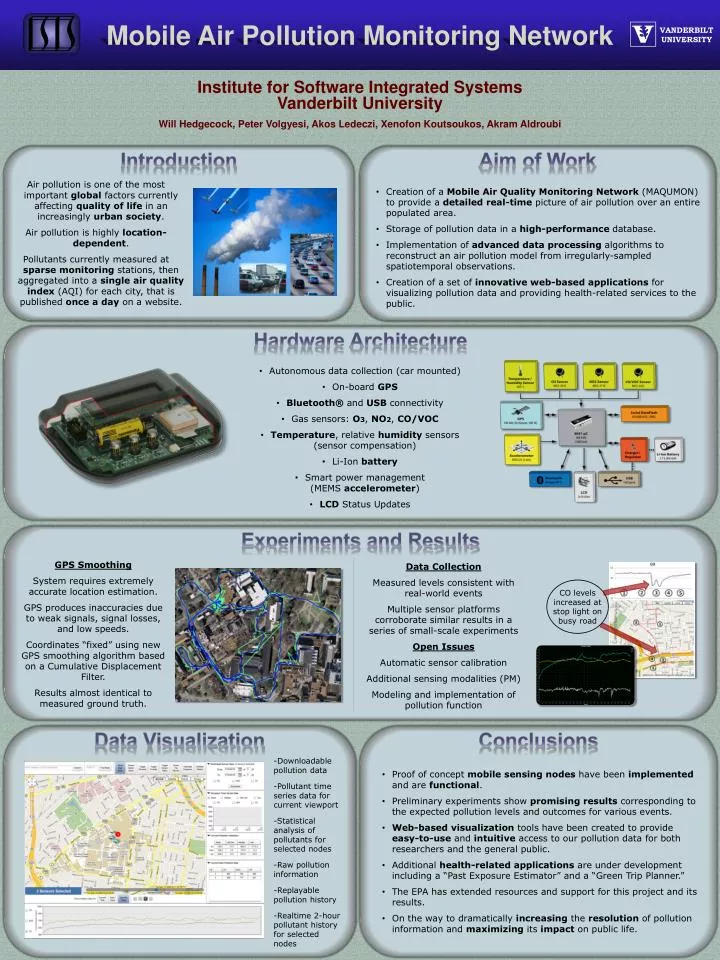
Mobile Air Pollution Monitoring Network. VANDERBILT UNIVERSITY. Institute for Software Integrated Systems Vanderbilt University Will Hedgecock, Peter Volgyesi, Akos Ledeczi, Xenofon Koutsoukos, Akram Aldroubi. Introduction. Aim of Work.

E N D
Mobile Air Pollution Monitoring Network VANDERBILT UNIVERSITY Institute for Software Integrated Systems Vanderbilt University Will Hedgecock, Peter Volgyesi, Akos Ledeczi, Xenofon Koutsoukos, Akram Aldroubi Introduction Aim of Work Air pollution is one of the most important global factors currently affecting quality of lifein an increasingly urban society. Air pollution is highly location-dependent. Pollutants currently measured at sparse monitoring stations, then aggregated into a single air quality index (AQI) for each city, that is published once a day on a website. • Creation of a Mobile Air Quality Monitoring Network (MAQUMON) to provide a detailed real-time picture of air pollution over an entire populated area. • Storage of pollution data in a high-performance database. • Implementation of advanced data processing algorithms to reconstruct an air pollution model from irregularly-sampled spatiotemporal observations. • Creation of a set of innovative web-based applications for visualizing pollution data and providing health-related services to the public. Hardware Architecture • Autonomous data collection (car mounted) • On-board GPS • Bluetooth® and USB connectivity • Gas sensors: O3, NO2, CO/VOC • Temperature, relative humidity sensors (sensor compensation) • Li-Ion battery • Smart power management (MEMS accelerometer) • LCD Status Updates GPS Smoothing System requires extremely accurate location estimation. GPS produces inaccuracies due to weak signals, signal losses, and low speeds. Coordinates “fixed” using new GPS smoothing algorithm based on a Cumulative Displacement Filter. Results almost identical to measured ground truth. Data Collection Measured levels consistent with real-world events Multiple sensor platforms corroborate similar results in a series of small-scale experiments Open Issues Automatic sensor calibration Additional sensing modalities (PM) Modeling and implementation of pollution function CO levels increased at stop light on busy road Experiments and Results -Downloadable pollution data -Pollutant time series data for current viewport -Statistical analysis of pollutants for selected nodes -Raw pollution information -Replayable pollution history -Realtime 2-hour pollutant history for selected nodes • Proof of concept mobile sensing nodes have been implemented and are functional. • Preliminary experiments show promising results corresponding to the expected pollution levels and outcomes for various events. • Web-based visualization tools have been created to provide easy-to-useand intuitive access to our pollution data for both researchers and the general public. • Additional health-related applications are under development including a “Past Exposure Estimator” and a “Green Trip Planner.” • The EPA has extended resources and support for this project and its results. • On the way to dramatically increasing the resolution of pollution information and maximizing its impact on public life. Data Visualization Conclusions