Download
1 / 6
60 likes | 65 Views
This study measures benzene levels in the Denver-Julesburg oil and gas basin, revealing high concentrations exceeding EPA toxic limits. Source fingerprinting identifies the location of benzene sources.

E N D
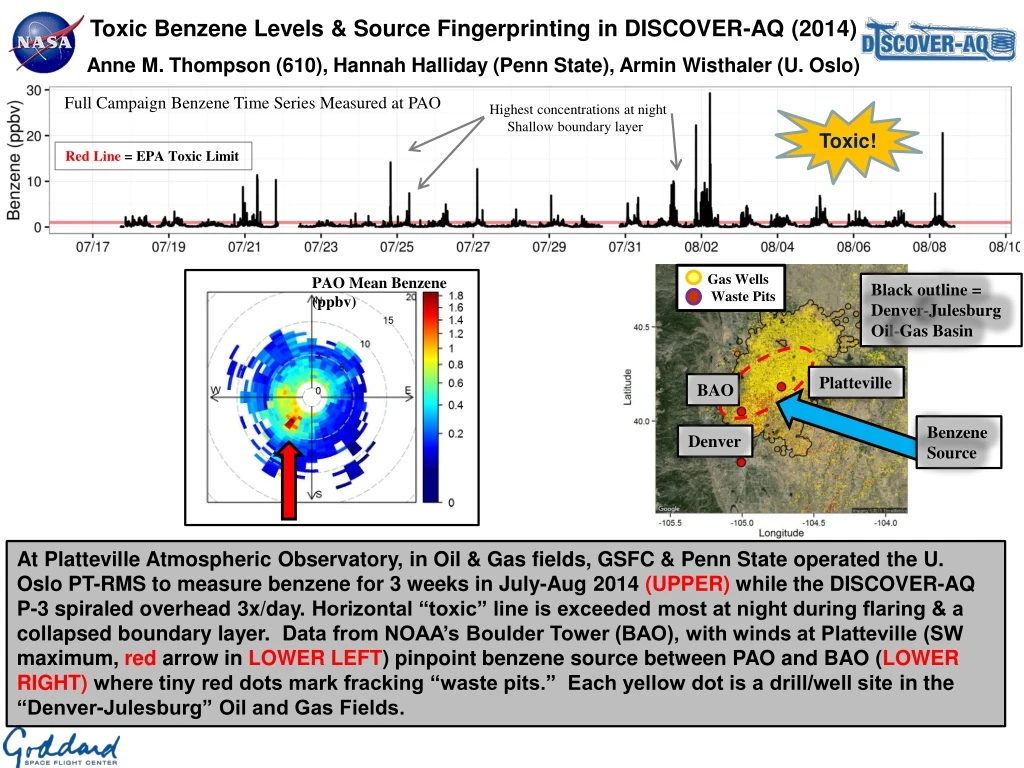
Toxic Benzene Levels & Source Fingerprinting in DISCOVER-AQ (2014) Anne M. Thompson (610), Hannah Halliday (Penn State), Armin Wisthaler (U. Oslo) PAO Mean Benzene (ppbv) Full Campaign Benzene Time Series Measured at PAO Highest concentrations at night Shallow boundary layer Toxic! Red Line = EPA Toxic Limit Gas Wells Waste Pits Black outline = Denver-Julesburg Oil-Gas Basin Platteville BAO Benzene Source Denver At Platteville Atmospheric Observatory, in Oil & Gas fields, GSFC & Penn State operated the U. Oslo PT-RMS to measure benzene for 3 weeks in July-Aug 2014 (UPPER) while the DISCOVER-AQ P-3 spiraled overhead 3x/day. Horizontal “toxic” line is exceeded most at night during flaring & a collapsed boundary layer. Data from NOAA’s Boulder Tower (BAO), with winds at Platteville (SW maximum, red arrow in LOWER LEFT) pinpoint benzene source between PAO and BAO (LOWER RIGHT)where tiny red dots mark fracking “waste pits.” Each yellow dot is a drill/well sitein the “Denver-Julesburg” Oil and Gas Fields.
Name: Anne M. Thompson, NASA/GSFC, Code 610 E-mail: anne.m.thompson@nasa.gov Phone: 301-614-5905 Reference: H. S. Halliday, A. M. Thompson, A. Wisthaler, D. R. Blake, R. S. Hornbrook, M. Müller, T. Mikoviny, E. C. Apel, A. J. Hills. Atmospheric benzene observations from a heavily developed oil and gas field in the Denver Julesburg basin, J. Geophys. Res., doi: 10.1002/2016JD02534729, 2016. (Published, 20 Sept.) Data Sources: All Data are provided by the NASA Earth Venture DISCOVER-AQ (Deriving Information on Surface Conditions from COlumn and VERtically Resolved Observations Relevant to Air Quality) campaign that consisted of four deployments in prototypically polluted locations: Maryland (2011), San Joaquin Valley & Houston (2013), Denver-Julesburg Basin (2014). All participants and instrumentation are described at the website: discover-aq.larc.nasa.gov. For the July-August 2014 Colorado campaign, besides the Penn State NATIVE & U. Oslo trailers, hydrocarbons were measured by a PT-RMS on the NASA P-3 and by the NCAR C-130 as part of the FRAPPE campaign. Platteville and P-3 hydrocarbons matched perfectly. Canisters from U. Cal-Irvine at Platteville also helped fingerprint the Oil & Gas benzene source, ie there were high pentanes from oil and gas. Technical Description of Figures: Upper Figure: Time-series of benzene from the U. Oslo PT-RMS at the Platteville Atmospheric Observatory where GSFC and Penn State measured other pollutants continuously: ozone, NO/NOy, CO, SO2 and launched ozonesondes for boundary layer height. There is no “safe” level of benzene so 1 ppbv (part-per-billion) is the red line. Benzene at night often exceeded 10 ppbv. Lower Figures: The figure on the left combines the benzene concentrations in ppbv with wind direction of the sampled air. Wind was measured with an instrument on the Penn State NATIVE trailer. The SW segment dominates. Because BAO 25 km SW of Platteville recorded high benzene to the NW, it appears that the source of this benzene was about halfway between the two sampling sites. Scientific significance, societal relevance, and relationships to future missions: Benzene is a toxic chemical that is a byproduct of oil and gas exploration, chemical manufacture and cars and trucks. THE HIGH LEVELS WE MEASURED GOT THE NOTICE OF EPA AND COLORADO DEPT OF PUBLIC HEALTH AND ENVIRONMENT WHO HAD TO FILE REPORTS AND WHO NOW – THANKS TO NASA – WILL START MONITORING UNHEALTHY HYDROCARBONS (“VOC”) AT PLATTEVILLE THEMSELVES! Earth Sciences Division - Atmospheres
Improved Cirrus Cloud Retrievals from New MPLNET AlgorithmJ. Lewis1,2, E. Welton1, S. Stewart1,3, P. Haftings1,3, J. Campbell4 1Code 612, NASA/GSFC, 2UMBC JCET, 3SSAI, Inc., 4NRL Monterey Cirrus clouds over GSFC site, 2012 All clouds over GSFC site, 2012 V2 (1-min) No. of Cirrus Clouds = 57351 No. of Sub-visual Cirrus (COD < 0.03) = 20257 (35%) No. of Thin Cirrus (0.03 < COD < 0.3) = 28948 (50%) No. of Opaque Color Cirrus (0.3 < COD < 3) = 8146 (14%) V3b (1-min) V3m (merged) Opaque Altitude (km) Frequency Thin Sub-visual Occurrences Cloud Base Altitude (km) A new Version 3 (V3) algorithm has been developed to detect clouds from the Micropulse Lidar Network (MPLNET). When compared to Version 2 (V2), the V3 algorithm improves the ability to detect clouds at high altitudes (i.e. cirrus) and provides, for the first time, information about cloud phase and cloud optical depth (COD).
Name: Jasper Lewis, NASA/GSFC, Code 612, UMBC JCET E-mail: jasper.r.lewis@nasa.gov Phone: 301-614-6721 References: Lewis, J., J. Campbell, E. Welton, S. Stewart, and P. Haftings, 2016: Overview of MPLNET Version 3 Cloud Detection. Journal of Atmospheric and Oceanic Technology, 33, 2113–2134, doi: 10.1175/JTECH-D-15-0190.1. Campbell, J. R., S. Lolli, J. R. Lewis, Y. Gu, and E. J. Welton, 2016: Daytime Cirrus Cloud Top-of-the-Atmosphere Radiative Forcing Properties at a Midlatitude Site and Their Global Consequences. Journal of Applied Meteorology and Climatology, 55, 1667–1679, doi: 10.1175/JAMC-D-15-0217.1. Data Sources: NASA MPLNET, Goddard Earth Observing System – Version 5 (GEOS-5) data available from the Global Modeling and Assimilation Office, and CALIPSO Level 2, Version 3, 5-km cloud layer data obtained from the NASA Langley Research Center Atmospheric Science Data Center. Technical Description of Figures: Left figure: Cloud base height distributions for all clouds over the GSFC site during 2012. Results from the V2 algorithm at a one-minute temporal average are indicated by a solid line. Results from the V3 algorithm at the base one-minute average (V3b) are indicated by the dashed line. Multiple temporal resolutions are used to retrieve the most tenuous cirrus cloud layers. In addition to the base one-minute average, intermediate (five-minute) and long (twenty-minute) averages are combined to produce a merged cloud product (V3m), shown using a dash-dotted line. Right figure: Distribution of cloud base heights for cirrus clouds observed over the GSFC site during 2012. The colors indicate the cirrus type based on the estimated cloud optical depth (blue for sub-visual, yellow for thin, and red for opaque color) using an effective extinction-to-backscatter ratio of 30 sr. The combination of sub-visual and thin cirrus clouds accounts for over 85% of the sample, which is significant because these clouds are the most difficult to detect using passive remote sensing methods. However, it is noted that the limit to which the cirrus cloud optical depth could be reliably estimated occurs between of 0.5 and 0.8. Scientific significance, societal relevance, and relationships to future missions: Information about cloud height, thickness, occurrence, and amount are critical inputs for a host of numerical applications involving climate research. Therefore, it is important to have highly accurate and quantitative data records of cloud properties that span several years and geographic regions. The new MPLNET V3 algorithm increases the quality of detection for cirrus clouds which is significant for studies of radiative forcing, as cirrus are known to both warm and cool the atmosphere depending on their varying physical properties. Autonomous lidar monitoring projects, like MPLNET and CALIOP aboard the CALIPSO satellite, have already demonstrated that optically thin cirrus clouds are the most common cloud type in the earth–atmosphere system. Long-term ground-based datasets from MPLNET continue to provide crucial diurnal information to complement NASA satellite missions. Earth Sciences Division - Atmospheres
Fire-induced land conversion to cropland is increasing in middle Africa Charles Ichoku (NASA/GSFC/613) and Luke Ellison (NASA/GSFC/613/SSAI) Widespread burning that peaked in 2006 across the northern part of sub-Saharan Africa influences land-cover changes that result in a net conversion of 0.28%/year of the total land area to cropland, with the majority (0.18%/year) coming from savanna. Over the last decade, the trend is increasing from savanna, forest, and wetlands to cropland.
Name: Charles Ichoku, NASA/GSFC, Code 613 E-mail: charles.ichoku@nasa.gov Phone: 301-614-6212 References: Ichoku, C., Ellison, L. T., Willmot, K. E., Matsui, T., Dezfuli, A. K., Gatebe, C. K., Wang, J., Wilcox, E. M., Lee, J., Adegoke, J., Okonkwo, C., Bolten, J., Policelli, F. S., and Habib, S.: Biomass burning, land-cover change, and the hydrological cycle in Northern sub-Saharan Africa, Environmental Research Letters, 11(9), 95005, doi:10.1088/1748-9326/11/9/095005, 2016. Data Sources: MODIS Col. 5 Land Cover Type Product (MCD12Q1, https://lpdaac.usgs.gov/dataset_discovery/modis/modis_products_table/mcd12q1) MODIS Col. 6 Fire Radiative Power Product (MOD14/MYD14, http://modis-fire.umd.edu/pages/ActiveFire.php) Technical Description of Figures: Graphic 1: Land cover change between 2006, which was a peak fire year in Northern Sub-Saharan Africa (NSSA), and 2012 (the last available year for land cover analysis) highlights areas of significant change from savanna and forest to cropland (on a 1° grid). The left panels show the normalized average changes from year-to-year (from 2003-2012) from savanna and forest to cropland, whereas the right panels display the normalized differences in these land cover conversions between 2006 and 2012 (2012 minus 2006). This analysis is based on aggregated land-cover classifications using the IGBP scheme in the MODIS Collection 5 land-cover product (MCD12Q1), which is at 0.5 km resolution. All values are linearly scaled from zero to the maximum value on each panel, whereas gray represents the background. The farming culture in NSSA is known for its heavy dependence on burning practices. Although there is variable mutual exchange of different land cover types, cropland increased during 2003–2013 at an estimated rate of 0.28%/yr of the total NSSA land area, with most coming from savanna (0.18%/yr). During the last decade, conversion to croplands increased in some areas classified as forests and wetlands, posing a threat to these vital and vulnerable ecosystems. Scientific significance, societal relevance, and relationships to future missions: NSSA accounts for 20%–25% of the global carbon emissions from biomass burning. Given such overwhelming occurrence of biomass burning in this region and its inherent potential to affect vegetation changes, land degradation, deforestation, surface albedo, aerosol emissions, and surface evapotranspiration, it is reasonable to hypothesize that biomass burning, directly or indirectly, exerts significant impact on NSSA’s environmental dynamics and water cycle across different spatial and temporal scales. These results provide observational evidence of changes in land-cover that are consistent with feedbacks from biomass burning in NSSA, and encourage more synergistic modeling and observational studies (including field campaigns) that can elaborate this feedback mechanism and its wider ramifications. Earth Sciences Division - Atmospheres