Download
1 / 5
50 likes | 58 Views
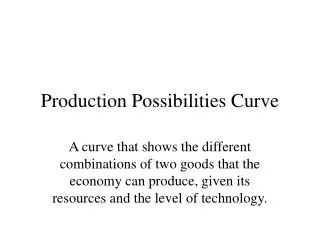
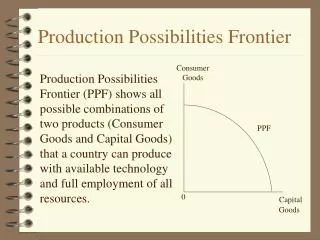
Production Possibilities Curves. 1-3. Why the Curve??. It shows alternative ways to use an economy’s resources. Production Possibilities Frontier. Shows combinations of the production of two products **Represents an economy working at most efficient levels

E N D
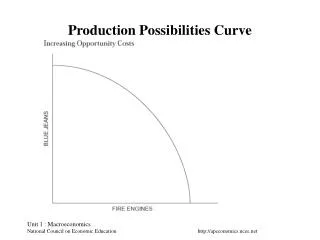
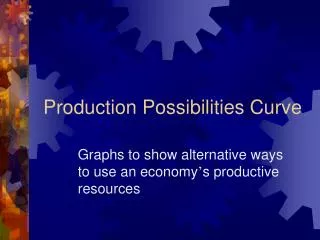
Why the Curve?? • It shows alternative ways to use an economy’s resources
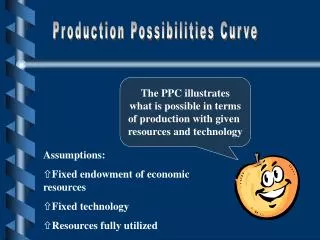
Production Possibilities Frontier • Shows combinations of the production of two products • **Represents an economy working at most efficient levels • Making more of one product means less of another--------Scarcity of resources.
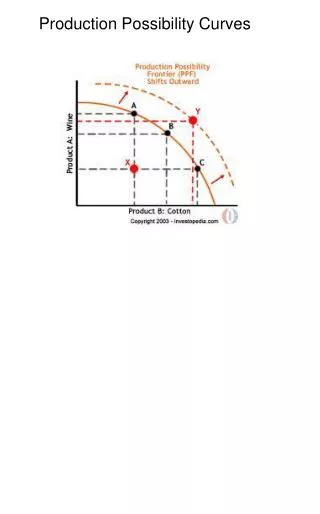
Efficiency and Growth • Underutilization: any point inside the frontier. Not using all of economies available resources • Shift to the right: more resources available and growth occurs • Shift to the left: resources lost and production capability decreases
Law of Increasing Cost • As production switches from one item to another, more and more resources are necessary to increase production of the second item • Figure 1.7(pg. 17)