Download
1 / 39
390 likes | 550 Views
f Meson Production in In-In Collisions and Highlights from NA60. Michele Floris 1 for the NA60 Collaboration Strangeness in Quark Matter 2007 1 University and INFN, Cagliari, Italy. Outline. The NA60 Experiment Detector Concept Phi Meson Production in In-In Collisions Analysis details

E N D
f Meson Production in In-In Collisions and Highlights from NA60 Michele Floris1 for the NA60 Collaboration Strangeness in Quark Matter 2007 1University and INFN, Cagliari, Italy
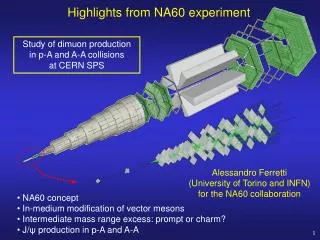
Outline • The NA60 Experiment • Detector Concept • Phi Meson Production in In-In Collisions • Analysis details • pT, y and decay angular distributions • f/w ratio • Highlights from NA60 • In medium modification of the r • Intermediate mass range excess: prompt or charm? • Centrality dependence of J/y suppression Strangeness in Quark Matter
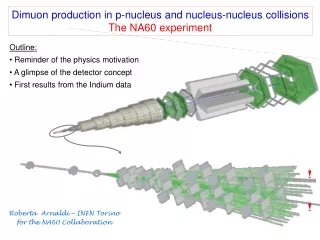
The NA60 Experiment 2.5 T dipole magnet muon trigger and tracking (NA50) beam tracker vertex tracker magnetic field targets Zero degree calorimeter (centrality measurements) 17m Muon Spectrometer hadron absorber <1m >10m The vertex region (2 detectors): • Fixed target dimuon experiment at the CERN SPS • Apparatus composed of 4 main detectors Concept of NA60: place a silicon tracking telescope in the vertex region to measure the muons before they suffer multiple scattering in the absorber and match them (in both angles and momentum) to the tracks measured in the spectrometer Origin of muonscan be accurately determined Improved dimuon mass resolution (~20 MeV/c2 at instead of 80 MeV/c2) High luminositymm experiment: possible with radiation tolerant detectors and high speed DAQ Strangeness in Quark Matter
Data Sample InIn collisions at 158 AGeV Incident beam energy 5 weeks in Oct.-Nov. 2003 ~ 4 ∙ 1012 ions delivered ~ 230 million dimuon triggers Data analysis Select events with only one reconstructed vertex in target region (avoid re-interactions) Match muon tracks from Muon Spectrometer with charged tracks from Vertex Tracker (candidates selected using weighted distance squared matching c2) Subtract Background Two data samples Different current settings in the Muon Spectrometer magnet Different acceptances High current setting suppresses LMR Strangeness in Quark Matter
f Meson Production: Motivation • Strangeness production in Heavy Ion Collisions • Mass and Width changes of the f in the medium • Differerences between f → KK and f → mm • K meson modification in the medium • pT dependence of K suppression • Two channels have been studied in 158 AGeV PbPb : • f mm • Muons not influenced by the medium • Previous SPS measurements: NA50 • Acceptance limited to high pT • f KK • Better mass resolution • No physical BG • Previous SPS measurements: NA49 • Broad pT coverage, but dominated by low pT • f puzzles: • Absence of in-matter modifications of width in KK • Discrepancy between absolute yields • Discrepancy between T slope: radial flow (NA49) or no radial flow (NA50)? • Measurements from NA60 in In-In collisions • NA60 measures the mm channel with good pT coverage (0-2.6 GeV) • Rapidity, decay angular distribution, pT and f/w ratio Strangeness in Quark Matter
Spectra: Analysis Procedure 5 centrality bins total f background We select the events on the f peak and use two side mass windows to estimate the pT,y and decay angle distribution of the continuum under the peak Acceptance would require correction with 2D matrices: pT vs y and decay angle vs pT After tuning MC to data (iterative procedure) 1D acceptance correction Systematic error: variation of analysis cuts and parameters 4000 A data set only
Rapidity Distribution s = 1.13 ± 0.06 ± 0.05 reflected All centralities sgaus sgauss Width estimated with a Gaussian fit Constant within errors Agreement with previous measurements in other colliding systems at the same energy Strangeness in Quark Matter
Decay Angular Distributions The 3 frames are identical for pT 0 First measurement in HI collisions at the SPS Helicity Gottfried-Jackson Collins-Soper z axis y pµ+ Hel pµ+ x y f GJ z axis pµ+ pprojectile ptarget y x CS pprojectile ptarget z axis Viewed from f rest frame pprojectile ptarget Viewed from f rest frame The angular distribution of the positive muon can be measured with respect to 3 different quantization axes • Collins – Soper • Gottfried – Jackson • Helicity Angular distributions fitted with the function: polarization Provides information on the production mechanism Previousmeasurements: ACCMOR (h-Be) and Sixel et al. (K- - p / p- - p) Non negligible a (GJ Frame) Heavy Ion Global polarization? We studied centrality and pT dependence of a in the 3 frames Further developments: azimuthal distributions, study wrt the reaction plane Strangeness in Quark Matter
Helicity Distribution a = 0.1 ± 0.1 ± 0.1 All centralities pT > 0.2 GeV/c • = 0, independent of centrality • Analysis repeated at pT < 1 GeV and pT > 1GeV. • No evidence for a ≠ 0. Strangeness in Quark Matter
Gottfried – Jackson Distribution a = 0. ± 0.1 ± 0.04 All centralities pT > 0.2 GeV/c • = 0, independent of centrality • Analysis repeated at pT < 1 GeV and pT > 1GeV. • No evidence for a ≠ 0. Strangeness in Quark Matter
Collins – Soper Distribution a = -0.2 ± 0.2 ± 0.2 All centralities pT > 0.2 GeV/c Hint for a < 0 in peripheral events? Not significant (2s). Acceptance limits fit range Large errors on a Analysis repeated at pT < 1 GeV and pT > 1GeV. No evidence for a ≠ 0. Strangeness in Quark Matter
mT Distribution Spectra fitted with the function: Depends on the fit range in presence of radial flow Effective temperature Centrality dependence stronger at low pT Linear mass dependence at low pT Strangeness in Quark Matter
Tslope: Fit Range Dependence NA60 In-In (pT > 1.1 GeV/c) NA49 Pb-Pb NA50 Pb-Pb NA60 In-In (pT < 1.6 GeV/c) NA49 Pb-Pb NA50 Pb-Pb Low pT (NA49):Agreement with NA49 when the fit is performed in the same range High pT (NA50): Lower T absolute values, flatter rise with centrality. No agreement with NA50 Difference between NA50 and NA49 was not due to different decay channel Hint for the presence of radial flow → Blast Wave analysis Strangeness in Quark Matter
f/w ratio: Analysis Procedure MC Data pT > 1 GeV/c f/w ratio extracted from a fit of the mass distribution with expected sources: Parameters allowed to vary: h/w, r/w, f/w and the continuum • 2-body and Dalitz decays of low mass • mesons • Open charm continuum (low level) r region in central bins parameterised to reproduce the NA60 excess data. Little dependence on the parameterisation (~ 5%) Strangeness in Quark Matter
f/w ratio pT > 1 GeV/c Full pT and y f yield increases from peripheral to central collision by a factor ~ 3 (Consistent with previous measurement) Absolute yield measurement in progress Strangeness in Quark Matter
IMR Excess: Previous Measurements NA38/NA50 proton-nucleus data centralcollisions M (GeV/c2) • NA38/NA50 was able to describe the IMR dimuon spectra in p-A (Al, Cu, Ag, W) collisions at 450 GeV as the sum of Drell-Yan and Open Charm contributions. • However, the yield observed by NA50 in heavy-ion collisions (S-U, Pb-Pb) exceeds the sum of DY and Open Charm decays, extrapolated from the p-A data (factor ~2 excess for central Pb-Pb). • The study of this excess was one of the main objectives of the NA60 experiment at SPS. Strangeness in Quark Matter
NA60 Measurement of the IMR excess J/ muons NA60 can separate the prompt and open charm contribution on a statistical basis by measuring the dimuon offset with respect to the primary vertex To eliminate the momentum dependence of the offset resolution, we use the muon offset weighted by the error matrix of the fit: Single muon weighted offset Offset resolution ≈ ~40 m, < ct (D+ : 312 m, Do : 123 m) Dimuon weighted offset Strangeness in Quark Matter
IMR: Expected Sources Analysis of the mass spectra in the range 1.16 GeV/c2 < Mmm< 2.56 GeV/c2 Coverage in Collins-Sopper angle: | cos qCS | < 0.5 Analysis repeated for the 2 samples (4000 A and 6500 A) and for different cuts on the matching c2 (c2match < 1.5 and c2match < 3.0) Sources (open charm and Drell Yan) simulated using Pythia Monte Carlo dimuons reconstructed on top of a real event Relative normalization: Drell Yan: Reproduce high mass cross section measured by NA3 and NA50 Open Charm: Cross section which reproduces the NA50 p-A dimuon data Yield of expected sources in units of expected cross section in the following Strangeness in Quark Matter
Data integrated in collision centralities and in pT 4000 A, 2match <1.5 4000 A,2match <1.5 Fit range Fit range 6500 A, 2match <1.5 Fit of the mass spectra with prompts fixed to Drell-Yan (within 10%) shows that the dimuon yield in IMR is higher than expected and the fit to the offset spectra shows that the excess is prompt. 6500 A, 2match <1.5
Offset fits with free prompt and charm 4000 A, 2match < 3 4000 A, 2match <1.5 6500 A, 2match <1.5 6500 A, 2match < 3 • ~2.4 times more prompts are required than what Drell-Yan provides. • The two data sets, with different systematics, are consistent with each other • Obtained Charm contribution is lower than extrapolation from NA50 p-A data. Statistics is not enough for its study vs centrality and pT, it will be fixed to 0.7 0.15 (average of 4 and 6.5 kA data) Strangeness in Quark Matter
cc Cross Section Our statistics is not enough to study the differentially in centrality. But bulk of existing measurements is in agreement with expectation of its scaling with number of binary collisions, characteristic for hard process: = 1 in In further analysis the normalization factor for will be fixed to 0.7 0.15 (wrt extrapolation from NA50 pA data) leading to 9.5±2 b/nucleon H.Woehri and C.Lourenco, Phys.Rep. 433 (2006) 127-180 Strangeness in Quark Matter
sCC: comparison with other measurements NA60 H.Woehri and C.Lourenco, Phys.Rep. 433 (2006) 127-180 Effect of nuclear modification of PDFs Strangeness in Quark Matter
Excess corrected for acceptance Define the excess as Signal – [ Drell-Yan (1± 0.1) + Open Charm (0.7±0.15) ] Systematic errors account for uncertainty in Drell-Yan and Charm normalization factors The excess acceptance correction is done differentially in M and pT Assuming: flat cosCS distribution for decay angle and rapidity distribution similar to Drell-Yan (y~1) Once the excess is corrected for acceptance, the two data sets can be summed up Strangeness in Quark Matter
Centrality and pT dependence of excess Excess/Nparticipants(arb. scale) Excess already present in peripheral collisions, scales faster than NPart Excess stronger at low pT Strangeness in Quark Matter
pT Spectra of the excess Drell Yan TEFF is rather low compared both to the Drell-Yan and to the Low Mass Region (T ~ 250 MeV) Fit in PT<2.5 GeV/c Fit in 0.5<PT<2 GeV/c Strangeness in Quark Matter
Summary • f Meson Production • T slope increases with centrality and depends on fit range → hint for radial flow • Compatible with NA49 • Absolute yields measurement in progress • IMR excess • Excess is prompt • Open charm yield agrees with NA50 p-A • Excess is qualitatively different from Drell-Yan Strangeness in Quark Matter
The NA60 Collaboration CERN Heidelberg Bern Palaiseau BNL BNL Riken Yerevan Stony Brook Torino Lisbon Cagliari Clermont Lyon http://na60.cern.ch/ 56 people 13 institutes 8 countries R. Arnaldi, R. Averbeck, K. Banicz, K. Borer, J. Buytaert, J. Castor, B. Chaurand, W. Chen,B. Cheynis, C. Cicalò, A. Colla, P. Cortese, S. Damjanovic, A. David, A. de Falco, N. de Marco,A. Devaux, A. Drees, L. Ducroux, H. En’yo, A. Ferretti, M. Floris, P. Force, A. Grigorian, J.Y. Grossiord,N. Guettet, A. Guichard, H. Gulkanian, J. Heuser, M. Keil, L. Kluberg, Z. Li, C. Lourenço,J. Lozano, F. Manso, P. Martins, A. Masoni, A. Neves, H. Ohnishi, C. Oppedisano, P. Parracho,G. Puddu, E. Radermacher, P. Ramalhete, P. Rosinsky, E. Scomparin, J. Seixas, S. Serci, R. Shahoyan,P. Sonderegger, H.J. Specht, R. Tieulent, G. Usai, H. Vardanyan, R. Veenhof, D. Walker and H. Wöhri Strangeness in Quark Matter
f/w ratio pT > 1 GeV/c Full phase space NA60 NA50 (Arb. Rescaled) Compared to NA50 f/(r+w): NA50 data have a common mT > 1.5 GeV/c2 cut Extrapolated to pT > 1 GeV/c using Tslopemeasured by NA50 Ambiguity: need to assume r/w to extract f/w (Arbitrary rescaling of NA50 data) Strangeness in Quark Matter
pT Distribution Spectra fitted with the function: to extract the Tslope Depends on the fit range! central peripheral Strangeness in Quark Matter
Acceptance would require correction with 2D matrices: pT vs y and decay angle vs pT. After tuning MC to data (iterative procedure) 1D acceptance correction Systematic error: variation of analysis cuts and parameters: • c2 cut of Matched Dimuon • Fake subtraction method • Side windows Offset • Mass window width Strangeness in Quark Matter
(m) Dispersion between beam track andVT vertex 30 BT BT 20 10 Vertex resolution (deconvoluting sBT=20 mm) 0 Number of tracks Vertex resolution (in the transverse plane) Beam Tracker measurement vs. vertex reconstructed with Vertex Tracker The BT measurement ( = 20 m at the target) allows us to control the vertexing resolution and systematics The interaction vertex is identified witha resolution of 10–20 mm accuracy in the transverse plane
NA60 Signal Analysis: simulated sources • Charm and Drell-Yan contributions are obtained by overlaying real event data on dimuons generated by Pythia 6.326 (CTEQ6L PDFs with EKS98 nuclear modifications. mc=1.5 GeV/c2. kT=0.8 for Drell-Yan and 1 for Charm) • The fake matches in the MC events are subtracted as in the real data, by event mixing. • Relative normalizations: Drell-Yan: K-factor of 1.9. Reproduces In-In data at M>4 GeV/c2 and cross sections measured by NA3 and NA50 (J. Badier et al. (NA3 Coll.), Z.Phys.,C26: (1985) 489. M.C. Abreu et al. (NA50 Coll.), Phys. Lett. B410(1997) 337). Charm: = 13.6 b/nucleon. Obtained from the cross section describing NA50 p-A dimuondata at 450 GeV by its rescaling to 158 GeV using Pythia.Note: this is factor ~2 higher than the extrapolation from the “world average” cross section(H.Woehri and C.Lourenco, J.Phys. G30 (2004) 315)Possible explanation: both NA60 and NA50 detect dimuons only in |cos|<0.5, while shows very strong rise at large cos Our full phase space acceptance for charm is very sensitive to the correctness of kinematic distribution from Pythia Strangeness in Quark Matter
NA60 Signal analysis: simulated sources • Absolute normalization: the expected Drell-Yan contribution, as a function of the collision centrality, is obtained from the number of observed J/ events and the suppression pattern: • Data is split in 12 bins in collision centrality (number of participants obtained from the measured charged multiplicity in the Vertex Tracker). • In each bin the number of J/ events is extracted and corrected for the anomalous suppression(E.Scomparin, proceedings of Quark Matter 2006, Shanghai) • Expected number of events Drell-Yan events at 2.9<M<4.1 GeV/c2 is extracted from /DY accounting for the nuclear absorption of the J/. • A 10% systematical error (mostly due to the uncertainty of the J/ nuclear absorption cross section) is assigned to this normalization. Signal shapes used to fit the dimuon weighted offset distributions are:prompt : mixture of J/ and data (open charm contamination is < 1%)charm: Monte Carlo smeared by amount needed for J/ and MC to reproduce data The fits to mass and weighted offset spectra are reported in terms ofthe DY and Open Charm scaling factors needed to describe the data Strangeness in Quark Matter
Muon track matching Matching between the muons in the Muon Spectrometer (MS) and the tracks in the Vertex Tracker (VT) is done using the weighted distance (2) in slopes and inverse momenta. For each candidate a global fit through the MS and VT is performed, to improve kinematics. A certain fraction of muons is matched to closest non-muon tracks (fakes). Only events with 2< 3 are selected (standard analysis). Fake matches are subtracted by a mixed-events technique and an overlay MC method (only for signal pairs, see below) Strangeness in Quark Matter
Combinatorial Background CB (uncorrelated muon pairs coming from p and K decays) is estimated with an Event Mixing technique Take muons from different events and calculate their invariant mass. Takes account of charge asymmetry, correlations between the two muons (induced by magnetic field sextant subdivision: detector geometry), trigger conditions Apparatus triggers both opposite sign (m+m-) and like sign (m+m+ , m-m-) pairs. Quality of CB is assessed comparing LS spectra. Accuracy ~1% over several orders of magnitude! Fakes in CBalso subtracted! Strangeness in Quark Matter
Fake Matches target muon trigger and tracking fake correct hadron absorber • “Fake Matches” are those tracks where a muon track from the Muon Spectrometer is matched to the wrong track from the Vertex Tracker • Fake matches ofthe signal pairs (<10% of CB) can be obtained in two different ways: • Overlay MC Superimpose MC signal dimuons onto real events. Reconstruct and flag fake matches. Choose MC input such as to reproduce the data. Start with hadron decay cocktail + continuum; improve by iteration. • Event mixing More rigorous, but more complicated. Less statistics Strangeness in Quark Matter
Example of Overlay MC: the Fakes calculation with Overlay MC and Mixing method agree in absolute level and shape within 5%! sf= 23 MeV sfake = 110 MeV Strangeness in Quark Matter
Clean Spectrum f For the first time and peaks clearly visible in dilepton channel (23 MeV mass resolution at the f) also visible Fakes/CB < 10 % Strangeness in Quark Matter