Download
1 / 28
290 likes | 419 Views
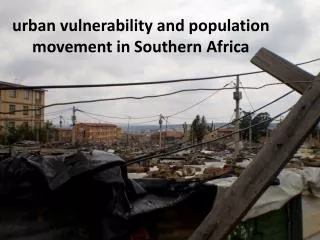
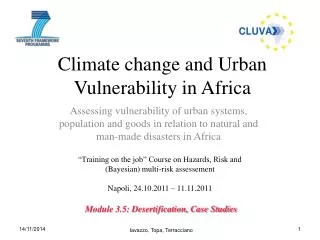
Climate change and Urban Vulnerability in Africa. Assessing vulnerability of urban systems , population and goods in relation to natural and man-made disasters in Africa. “Training on the job” Course on Hazards, Risk and (Bayesian) multi-risk assessement

E N D
Climate change and Urban Vulnerability in Africa Assessingvulnerability of urbansystems, population and goods in relation to natural and man-made disasters in Africa “Training on the job” Course on Hazards, Risk and (Bayesian) multi-risk assessement Napoli, 24.10.2011 – 11.11.2011 Module 3.5: Desertification, Case Studies Iavazzo, Topa, Terracciano 04/11/2011
AREAS AT RISK FROM DESERTIFICATION (Waugh, 1995)
DESERTIFICATION In africa Source: UN - United Nations
DESERTIFICATION In WEStafrica St. Louis Ouagadougou Douala Source: UN - United Nations
DESERTIFICATION In EAST africa Addis Ababa Dar EsSalaam Source: UN - United Nations
MEDALUS METHODOLOGY ESAs model was developed in Mediterranean habitat. The application of this methodology in west Africa sub-Saharan areas needs a readjustment for some parameters to adapt the classes and weigh of indices to different habitat conditions. • The readjustment of vegetation index was made starting from classification of the dominant natural vegetation and agricultural crops in sub-Saharan west Africa, and subsequently weighing indices in relation to the four sub-indices. • Mediterranenan area Sub-Saharan west Africa ClassVegetation 1 MixedMediterranean macchia/evergreen forest 2 Mediterranean macchia 3 Permanentgrassland 4 Annualgrassland 5 Deciduousforest 6 Pine forest 7 Evergreen forestexcept pine forest 8 Evergreen perennialagriculturalcrops 9 Deciduousperennialagriculturalcrops 10 Annualwinteragriculturalcrops 11 Annualsummeragriculturalcrops 12 Bare land ClassVegetation 1 Tropicalrainforest 2 Woodlandsavanna 3 Grasslandsavanna 4 Steppe 5 Semidesert 6 Annualagricolturalcrops 7 Perennialagricolturalcrops 8 Bare areas
MEDALUS METHODOLOGY Fire Risk Erosion Protection Drought Resistance Plant Cover VQI Vegetation Quality Index Mean Annual Rainfall Aspect Aridity Index CQI Climate Quality Index ESAI Soil Texture Rock Fragment Slope Gradient Soil Depth Parent Material Drainage SQI Soil Quality Index MQI Management Quality Index Land Use Type Land Use Intensity Policy (Kosmas et al., 1999)
CASE STUDY: BURKINA FASO STUDY AREA: OUAGADOUGOU REGION 100 km 50 km
VQI REFERENCE DATA LAND COVER MAP FAO, 2009
VQI VEGETATION QUALITY INDEX FIRE RISK 100 km
VQI VEGETATION QUALITY INDEX EROSION PROTECTION 100 km
VQI VEGETATION QUALITY INDEX DROUGHT RESISTANCE 100 km
VQI VEGETATION QUALITY INDEX PLANT COVER 100 km
VQI VEGETATION QUALITY INDEX Urban area Non affected Potential Fragile 1 Fragile 2 Fragile 3 Critical 1 Critical 2 Critical 3 100 km
CQI Climate QUALITY INDEX AI = P/ETP = 0.5 P: meanannualrainfall ETP: potential evapotranspiration (calculated by method of Thornthwaite) 100 km
SQI REFERENCE DATA PEDOLOGICAL MAP PEDOLOGICAL MAP PEDOLOGICAL MAP O.R.S.T.O.M., 1973 – 1/500000 I.R.A.T., 1985 – 1/1000000 O.R.S.T.O.M., 1976 – 1/500000 GEOLOGICAL MAP DOMINANT SOILS D.G.M., 1976 – 1/1000000 FAO, 2001
SQI SOIL QUALITY INDEX TEXTURE 100 km
SQI SOIL QUALITY INDEX ROCK FRAGMENTS 100 km
SQI SOIL QUALITY INDEX SLOPE 100 km
SQI SOIL QUALITY INDEX SOIL DEPTH 100 km
SQI SOIL QUALITY INDEX PARENT MATERIAL 100 km
SQI SOIL QUALITY INDEX DRAINAGE 100 km
SQI SOIL QUALITY INDEX Urban area Non affected Potential Fragile 1 Fragile 2 Fragile 3 Critical 1 Critical 2 Critical 3 100 km
MQI MANAGEMENT QUALITY INDEX LAND USE CROPLAND AREAS 100 km
MQI MANAGEMENT QUALITY INDEX LAND USE PASTURE AREAS 100 km
MQI MANAGEMENT QUALITY INDEX POLICY 100 km
MQI MANAGEMENT QUALITY INDEX Urban area Non affected Potential Fragile 1 Fragile 2 Fragile 3 Critical 1 Critical 2 Critical 3 100 km
MEDALUS METHODOLOGY Urban area Non affected Potential Fragile 1 Fragile 2 Fragile 3 Critical 1 Critical 2 Critical 3 100 km