Download
1 / 72
730 likes | 872 Views
Moving INDIA to 2032 National Transport Development Policy Committee ( NTDPC ) Sector Report – RAILWAYS. Highlights by Rajnish Kumar Professor IT National Academy of Indian Railways, Vadodara pit@nair.railnet.gov.in. Background.

E N D
Moving INDIA to 2032National Transport Development Policy Committee (NTDPC)Sector Report – RAILWAYS Highlights by Rajnish Kumar Professor IT National Academy of Indian Railways, Vadodara pit@nair.railnet.gov.in
Background The Government of India set up a High Level National Transport Development Policy Committee (NTDPC) on 11 February 2010. The main objective of setting up this Committee was to develop long term national transport policy (with a twenty year horizon) which facilitates overall growth and efficiency in the economy, while minimising energy use and effects on climate change. http://planningcommission.nic.in/sectors/NTDPC/TOR_CabSec_NTDPC.pdf
The Full Report(hyperlinks to the website) India Transport Report : Moving India to 2032 Download Complete Reports : Volume I || Volume II || Volume III India Transport Report : Moving India to 2032 (Chapter wise) Published on 17th June 2014 A) VOLUME I : Executive Summary B) VOLUME II: Main Report- Part I Preface NTDPC’s Approach to Transport Policy Trends in Growth and Development of Transport Macroeconomic Growth Backdrop: Transport Investment Requirements 2012-2032 Integrated Transport: Strategy and Logistics Institutions for Transport System Governance Regulatory Issues: An Overall Approach Annexes to Preface [ Download: Complete Part I ] VOLUME II: Main Report- Part II Energy and Environment Transportation of Energy Commodities Fiscal Issues Potential of Information and Communication Technology to Enhance Transport Efficiency Research and Human Resource Development Safety Promoting International Transport Connectivity Between India and the South and South East Asia Regions [ Download: Complete Part II ] C) VOLUME III: Sector Reports Part I Railways Roads and Road Transport Civil Aviation [ Download: Complete Part I ] Sector Reports Part II Ports and Shipping Urban Transport Transport Development in the North East [ Download: Complete Part II ]
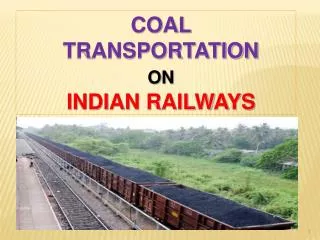
Dominance of Road in Freight The dominance of the road sector in freight transport in India is corroborated by two independent studies carried out by RITES and McKinsey. Both the studies estimate the share of Railways in freight transport in Net TonneKilometres (NTKMs) in India to be around 36 per cent
IR’s share in originating tonnage The RITES study also shows that over the years IR’s share (in originating tonnage) has come down from 89 per cent in 1951 to 30 per cent in 2007-08
IR’s share in PKMs A similar trend is observed in passenger transport, where the share of IR (in PKMs) has declined from 74.3 per cent in 1951 to 12.9 per cent in 2004-05, while the share of road has increased from 25.7 per cent to 86.7 per cent during the period
Actual vs Optimal Modal Mix RITES Total Transport System Study (TTSS) has estimated the total resource costs associated with different modes of transport. The assessment of actual and optimal modal mix computed on the basis of this methodology is summarized
Restore the balance in intermodal mix Current trajectory Balanced (Desirable)
Growth in total originating passengers During the last decade (2001-11) the trend of suburban category being the driver of growth reversed and non-suburban passenger category has been the key driver of growth in total originating passengers with a CAGR of 6.2 per cent, compared to 3.6 per cent for the suburban passengers.
Passenger Lead on IR The lead in the nonsuburban category increased much faster (CAGR of 3 per cent) compared to suburban category (CAGR of 0.8 per cent) over the same period
LINE CAPACITY UTILISATION OF SECTIONS ON HIGH DENSITY NETWORK These routes have reached over saturated levels of capacity utilization and at present are strained to the breaking point. Note: A line-capacity utilization of 80 per cent is considered optimum as smooth operation of trains requires some slack in the line-capacity to absorb and recover from unforeseen disruptions.
Freight Growth in IR Note: IR has focused on carrying bulk cargo in train-loads dominated by a narrow basket of nine commodities such as coal (46 per cent), iron ore, cement, fertilisers, steel, raw materials for steel plants except iron ore, foodgrains, petroleum products and container traffic, together these account for over 90 per cent of the freight traffic.
Staff Productivity Note: The major force driving the marginal increase in productivity has been the increase in transport volumes due to technology upgrade and appropriate operating strategies, combined with reduction in the number of employees from a peak of 1.65 million in 1990-91 to 1.32 million in 2010-11. Over the years, productivity measured in terms of transport output (NTKM+PKMs in millions) per employee of IR has increased from 0.23 (1980-81) to 1.2 (2010-11)
Staff Productivity Comparison The much higher staff productivity in the US and Canada vis-à-vis India; China and Russia can be partly explained by the difference in overall freight and passenger mix, as the larger passenger volumes handled in India, China and Russia require a more labour-intensive service response than freight
Discussion on Asset Productivity Network utilisation: The three networks that handle substantial passenger volumes (India, China and Russia) as well as freight have the highest overall network use, but such use can also be heavily influenced by the technology and operational standards. The average is also affected by the relative intensity of use of different parts of the network. For example, whereas nearly China’s entire network is heavily used, the Indian average contains around 9,000 kms (more than 14 per cent of the network) of little-used non broad-gauge lines carrying only around 1 per cent of rail traffic.
Discussion on Asset Productivity Locomotive productivity: The achievable productivity is partly influenced by the markets offering, which differ from country to country. Modern locomotive types and technologies also have higher haulage capability. Productivity is also influenced by the maintenance standards and efficiency of equipment. India is significantly behind other countries in locomotive productivity
Discussion on Asset Productivity Wagon productivity: The achievable productivity depends partly on traffic mix; other things equal, it should be higher with longer length of haul, higher proportions of bulk relative to non-bulk traffic, and the use of non-specialist wagons for a variety of traffic types. It is also influenced by train operating strategies and the efficiency of customers’ terminal operations. High utilisation generally assists in controlling operating costs, but it can occur at the expense of customers: for example many customers may prefer to use specialised wagons. Source: Freight Railways Governance, Organisation and Management: An International Roundup; The World Bank; Paul F. Amos, 7 July 2011.
Trends in Railway investment Note: IR’s expenditure as a percentage of the transport sector expenditure has varied considerably over the Plan periods, as it moved from a peak of 67 per cent in the 3rd to a low of 30 per cent in the 11th Plan
Investments & Sources of Funding The total investment in railways in each successive plan started increasing at a sharp rate from the 6th Plan (1980-85) onwards. The total public sector investment has increased manifold from around Rs 66 billion in the 6th Plan, to around Rs 1,900 billion in the 11th Plan. However, the IR’s expenditure as a percentage of the transport sector expenditure has varied considerably over the Plan periods, as it moved from a peak of 67 per cent in the 3rd to a low of 30 per cent in the 11th Plan (Figure 1.15).
Intermodalism, Multimodalism and Logistics Capability – World experience Source: Freight Railways Governance Organisation and Management: An International Round-up, World Bank, Paul Amos, July 2011.
Intermodalism, Multimodalism and Logistics Capability – World experience Source: Freight Railways Governance Organisation and Management: An International Round-up, World Bank, Paul Amos, July 2011.
ORGANISATIONAL REFORMS • Institutional separation of roles into policy, regulatory and management functions. • NTDPCrecommends the separation of Railways management and operations from the Government. • The Ministry of Railways (or the unified Ministry of Transport) in the future should be limited to setting policies • A new Railways Regulatory Authority would be responsible for overall regulation, including the setting of tariffs; • The Indian Railways Corporation (IRC) to be set up as a statutory corporation, which would retain many of the quasi governmental powers endowed to the Railways under the current Act. • Existing railways corporations such as CONCOR, DFCCIL, and the like will become subsidiaries or joint ventures of the IRC.
ORGANISATIONAL REFORMS ...2 • For these reforms to be implemented, the Railways Act, 1989, and the Indian Railway Board Act, 1905, will have to be amended accordingly. • Corporatisation of the existing public sector Railways Production Units. • To facilitate these reforms, the NTDPC recommends that the Railways should undertake recasting of its accounts in a company account format consistent with accounting norms under the Indian GAAP. • It should be reorganised in terms of business lines such as infrastructure management, freight transportation, passenger transportation, parcel and miscellaneous activities should similarly be organised as separate profit-centres by IR. • All activities falling outside the core transportation operations should be critically reviewed from the perspective of either retention or outsourcing.
ORGANISATIONAL REFORMS ...3 • GMs of Zonal Railways to be empowered to take decisions that enhance revenue, reduce costs or build platform for higher growth in future. • GMs should have the power to take such decisions without reference to Railway Board within a framework of rules and investment limits. • Simultaneously, the Zonal Railways would be made accountable for return on capital, transport output, profitability and safety. • Organisational and institutional deficiencies inhibiting PPP need to be identified and addressed. • The existing PPP policy framework should be reviewed in the light of hitherto poor response and PPP experience
GOALS FOR 2032, STRATEGIC PLAN AND BUSINESS STRATEGY • Optimal market share in freight: Aim to attain 50 per cent market share in inter-regional freight traffic by 2032, up from the current level of about 33 per cent. • Indian Railways to satisfy passenger service demand in full. • A shift of long-distance (500 km and above) transport of parcels - essentially non-bulk packaged items - to rail is a must. • A multi-year investment plan fully supported by a credible funding plan will form the bedrock of the strategic plan.
International Experience:Freight as a Business Distinct from Passenger Transport
FREIGHT AND PARCEL BUSINESS STRATEGY • Indian Railways to capture a significant share of the fast-growing FMCG, Consumer Durable and Information Technology (CDIT), containerised cargo and other segments like automobiles, etc., where its presence is negligible. • In this regard an organised intermodal transport system which will combine the advantages of rail with that of road is needed. • Setting up of a focused business organisation for multimodal transport of non-bulk commodities (e.g. parcels) under the PPP mode, combining the efficiency and advantages of rail and road. • Development of a few selected corridors for heavy-haul operations. • Development of last mile connectivity on PPP in a time-bound manner
FREIGHT AND PARCEL BUSINESS STRATEGY…2 • Running of freight trains at 100 km per hour. • Running of premium freight services with differential pricing and assured deliveries. • Supply of rakes on demand with differential pricing for different demand lead times. • Running of trains on schedule with guaranteed transit time. • Running of automobile, hazardous material trains, movement of bulk cement, etc by private train operators. • Reduction in cargo parcel size to 1,000 tonnes and aggregation mechanism for even smaller parcel-sizes. • Indian Railways to work closely with state and city authorities to set up rail-based multi-modal logistics parks to attract increasing volumes of miscellaneous cargo to rail.
PASSENGER BUSINESS STRATEGY • Upgrade speed to 160-200 kmph on select corridors. • Shift of focus to long-distance and inter-city transport and suburban corridors involving dense passenger movements. • Redevelopment of stations for smooth flow and comfortable experience of passengers as also to ensure clean and hygienic environment. • Redesign of coaches to enhance travel comfort. • Conversion of all stopping passenger trains to EMUs/DMUs or railcars; invitation to state governments to manage uneconomic and unpatronised services. • Augmentation of supply (more trains and longer trains) to ensure full satisfaction of demand.
Annex 1.2Routes Suggested for Increasing Maximum Permissible Speed to160-200 kmph
CAPACITY CREATION • Construction of 6 Dedicated Freight Corridors on top priority. • The Eastern DFC must be given the highest priority among the DFCs, and should be completed within the 12th Five Year Plan. • Further, construction of Eastern, East-West and East Coast DFCs must start from the eastern end. • Private sector participation should be encouraged for development and operations of the DFCs. • Eight critical feeder routes for coal with a combined length of about 600 km and several other critical links for the steel industry with a combined length of about 2,340 km must be completed on the highest priority within the 12th FYP. • Improved connectivity to industry clusters as well as significant ports (major and non-major), based on their current and projected traffic volumes. Development of last-mile connectivity should be encouraged through PPPs.
CAPACITY CREATION....2 • Development of 15 to 20 logistics parks as the main network hubs viz. Mumbai Bangalore, Cochin, Hyderabad, Kolkata, Delhi NCR, Ahmedabad, Nagpur, Vishakhapatnam, Siliguri, etc. • Upgrade wagons and track to 25-tonne axle load. • Upgrade rail wagons (higher axle load , better tare-to-payload by shifting away from carbon steel to stainless steel and aluminium/ other light-weight bodies, increased payload of covered wagons (BCN) through use of well wagons, better maintenance cycles, etc). • Expand partnership with private sector to facilitate development of private freight terminals, operation of container, automobile and special freight trains and third-party leasing of wagons. • Development of select High Speed Corridors (speed potential 350 Kmph) on a pilot basis, if and when deemed to be economically viable.
INVESTMENT PLANNING • IR needs to shift to a programme approach from the current project-oriented approach. • Quick pay-off projects that can ease the capacity constraint the fastest should be prioritised. • Investment should be focused on total capacity creation including rolling stock, asset renewal, technology induction, information technology, identified investments in modernisation, etc. • A more integrated approach is required to be taken of transport as a whole and choices will need to be made on the priorities to be placed on different investments. • Priority should be given to projects such as DFCs which are self financing and critical to achieve the target of 50 per cent share of railways in freight
INVESTMENT PLANNING...2 • A programme for raising speed to 160-200 kmph on selected existing routes should be undertaken, till the time the HSR projects are found commercially justified or operationally required to cater to the country’s growth and mobility needs. • IR should encourage participation of private players (both domestic and international) in setting up manufacturing facilities for rolling stock and components. • This would facilitate induction of world-class technology, besides being a source of capital for the resource constrained IR. • Replacement and renewal of assets should be ensured. • The ad hoc approach presently followed in respect of appropriation to Depreciation Reserve Fund needs to be overhauled and a rule-based approach needs to be put in place.
Broad heads for investments Capacity Augmentation (including safety works) Rolling Stock Stations & Terminals, Technological upgrade and modernisation
Summary of Capacity Augmentation: Figure 1.17 shows the summary of investments required for capacity augmentation by 2032. The total cost for various capacity augmentation initiatives discussed is close to Rs 12,500 billion, excluding the investments on new lines and HSR (the investment requirement increases to Rs 18,200 billion including these initiatives).