Download
1 / 1
10 likes | 150 Views
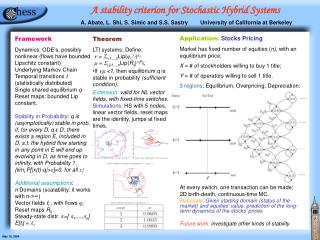
Amp. L. Sig. Gen. Rf. Ri. Flask. Vi. Vo. Osc. Syringe. 1. . 0. 30. . 1. . 0. 100. . SONOLUMINESCENCE AND BUBBLE STABILITY CRITERION Ryan Pettibone. BUBBLE STABILITY. ABSTRACT. THEORY. CONCLUSIONS.

E N D
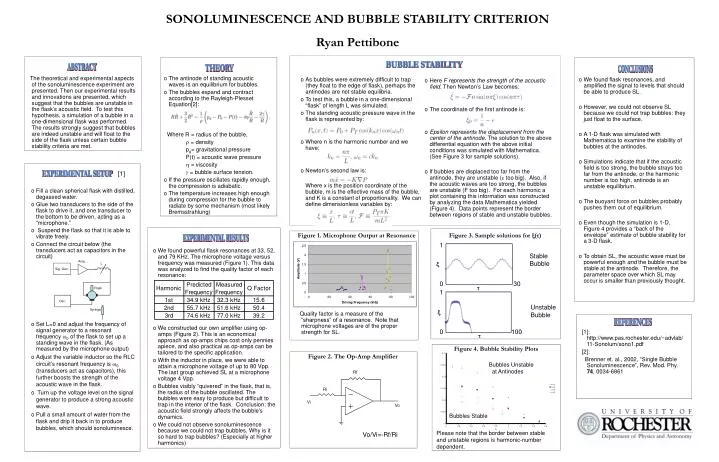
Amp. L Sig. Gen. Rf Ri Flask Vi Vo Osc. Syringe 1 0 30 1 0 100 SONOLUMINESCENCE AND BUBBLE STABILITY CRITERION Ryan Pettibone BUBBLE STABILITY ABSTRACT THEORY CONCLUSIONS The theoretical and experimental aspects of the sonoluminescence experiment are presented. Then our experimental results and innovations are presented, which suggest that the bubbles are unstable in the flask’s acoustic field. To test this hypothesis, a simulation of a bubble in a one-dimensional flask was performed. The results strongly suggest that bubbles are indeed unstable and will float to the side of the flask unless certain bubble stability criteria are met. • The antinode of standing acoustic waves is an equilibrium for bubbles. • The bubbles expand and contract according to the Rayleigh-Plesset Equation[2]: • Where R = radius of the bubble, • = density • pg= gravitational pressure • P(t) = acoustic wave pressure • = viscosity • = bubble surface tension. • If the pressure oscillates rapidly enough, the compression is adiabatic. • The temperature increases high enough during compression for the bubble to radiate by some mechanism (most likely Bremsstrahlung) • As bubbles were extremely difficult to trap (they float to the edge of flask), perhaps the antinodes are not stable equilibria. • To test this, a bubble in a one-dimensional “flask” of length L was simulated. • The standing acoustic pressure wave in the flask is represented by: • Where n is the harmonic number and we have: • Newton’s second law is: • Where x is the position coordinate of the bubble, m is the effective mass of the bubble, and K is a constant of proportionality. We can define dimensionless variables by: • We found flask resonances, and amplified the signal to levels that should be able to produce SL. • However, we could not observe SL because we could not trap bubbles: they just float to the surface. • A 1-D flask was simulated with Mathematica to examine the stability of bubbles at the antinodes. • Simulations indicate that if the acoustic field is too strong, the bubble strays too far from the antinode, or the harmonic number is too high, antinode is an unstable equilibrium. • The buoyant force on bubbles probably pushes them out of equilibrium. • Even though the simulation is 1-D, Figure 4 provides a “back of the envelope” estimate of bubble stability for a 3-D flask. • To obtain SL, the acoustic wave must be powerful enough and the bubble must be stable at the antinode. Therefore, the parameter space over which SL may occur is smaller than previously thought. • Here F represents the strength of the acoustic field. Then Newton’s Law becomes: • The coordinate of the first antinode is: • Epsilon represents the displacement from the center of the antinode. The solution to the above differential equation with the above initial conditions was simulated with Mathematica. (See Figure 3 for sample solutions). • If bubbles are displaced too far from the antinode, they are unstable ( too big). Also, if the acoustic waves are too strong, the bubbles are unstable (F too big). For each harmonic a plot containing this information was constructed by analyzing the data Mathematica yielded (Figure 4). Data points represent the border between regions of stable and unstable bubbles. [1] EXPERIMENTAL SETUP • Fill a clean spherical flask with distilled, degassed water. • Glue two transducers to the side of the flask to drive it, and one transducer to the bottom to be driven, acting as a “microphone.” • Suspend the flask so that it is able to vibrate freely. • Connect the circuit below (the transducers act as capacitors in the circuit) • Set L=0 and adjust the frequency of signal generator to a resonant frequency 0of the flask to set up a standing wave in the flask. (As measured by the microphone output) • Adjust the variable inductor so the RLC circuit’s resonant frequency is 0 (transducers act as capacitors), this further boosts the strength of the acoustic wave in the flask. • Turn up the voltage level on the signal generator to produce a strong acoustic wave. • Pull a small amount of water from the flask and drip it back in to produce bubbles, which should sonoluminesce. Figure 1. Microphone Output at Resonance Figure 3. Sample solutions for () EXPERIMENTAL RESULTS • We found powerful flask resonances at 33, 52, and 79 KHz. The microphone voltage versus frequency was measured (Figure 1). This data was analyzed to find the quality factor of each resonance: • We constructed our own amplifier using op-amps (Figure 2). This is an economical approach as op-amps chips cost only pennies apiece, and also practical as op-amps can be tailored to the specific application. • With the inductor in place, we were able to attain a microphone voltage of up to 80 Vpp. The last group achieved SL at a microphone voltage 4 Vpp. • Bubbles visibly “quivered” in the flask, that is, the radius of the bubble oscillated. The bubbles were easy to produce but difficult to trap in the interior of the flask. Conclusion: the acoustic field strongly affects the bubble’s dynamics. • We could not observe sonoluminescence because we could not trap bubbles. Why is it so hard to trap bubbles? (Especially at higher harmonics) Stable Bubble Unstable Bubble Quality factor is a measure of the “sharpness” of a resonance. Note that microphone voltages are of the proper strength for SL. REFERENCES [1]: http://www.pas.rochester.edu/~advlab/11-Sonolum/sono1.pdf [2]: Brenner et. al., 2002, “Single Bubble Sonoluminescence”, Rev. Mod. Phy. 74, 0034-6861 Figure 4. Bubble Stability Plots Figure 2. The Op-Amp Amplifier Bubbles Unstable at Antinodes Bubbles Stable Please note that the border between stable and unstable regions is harmonic-number dependent. Vo/Vi=-Rf/Ri