Download
1 / 13
130 likes | 228 Views
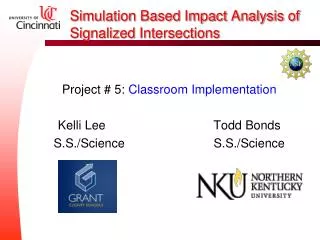
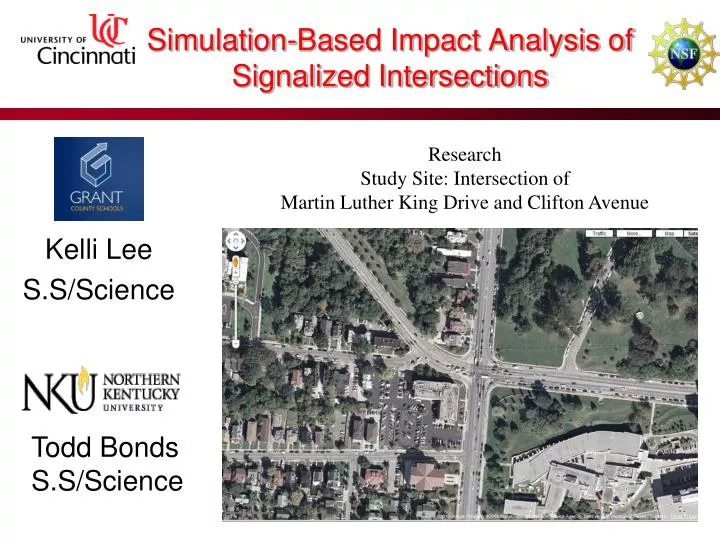
Simulation-Based Impact Analysis of Signalized Intersections. Research Study Site: Intersection of Martin Luther King Drive and Clifton Avenue. Kelli Lee S.S/Science. Todd Bonds S.S/Science. GOAL : Improve vehicular delay and CO emissions at signalized intersections. Objectives :

E N D
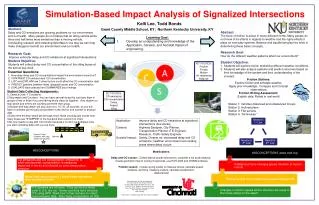
Simulation-Based Impact Analysis of Signalized Intersections Research Study Site: Intersection of Martin Luther King Drive and Clifton Avenue Kelli Lee S.S/Science Todd Bonds S.S/Science
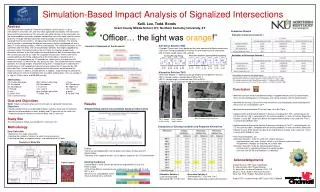
GOAL:Improve vehicular delay and CO emissions at signalized intersections. • Objectives: • Identify relationship between vehicles’ delay and CO emission; • Identify existing delay and CO emission; • Propose solutions to minimize delay & CO emission.
Delay and CO Results • Correlated patterns on the peaks and valleys; • Delay has an obvious impact on the CO concentration.
Existing Conditions • LOSs of the different movements are unbalanced • Overall emitted CO is 44.97g/hr. This is unacceptable! This is good!
Alternative Solution 1 Cycle length remains 90 seconds Phase 5 Phase 6 Phase 1 Phase 2 Phase 3 Phase 4 Phase 3 Phase 1 Phase 2 Phase 4 G: 4.0s Y: 3.0s R: 1.0s G: 9.0s Y: 3.0s R: 1.0s G: 0.5s Y: 3.0s R: 1.0s G: 24.0s Y: 3.6s R: 2.4s G: 13.5s Y: 3.6s R: 2.4s G: 11.0s Y: 3.0s R: 1.0s G: 11.0s Y: 3.0s R: 1.0s G: 6.0s Y: 3.0s R: 1.0s G: 38.0s Y: 3.6s R: 2.4s G: 15.0s Y: 3.6s R: 2.4s
Alternative Solution 1 Satisfactory (from “F”) 2.59s/veh better More Balanced
Alternative Solution 2 • Alternative Solution 1 +
Alternative Solution 2 BEST! BEST!
Conclusions • Correlated patterns on the peaks and valleys • Existing LOS unbalanced; Southbound left turn unacceptable LOS F. • Alternative Solution 1: delay 7.78%, CO emission 4.26%, • Alternative Solution 2: delay 14.68%, CO emission 9.68%, • Recommendations: • Alternative Solution 1 short-term solution • Alternative Solution 2 long-term plan
Questions??? THANK YOU!!
Lane Group Delay and LOS Rating Acknowledgements Andrea Burrows, RET Grant Coordinator Dr. Anant Kukreti, RET Project Director Dr. Heng, Wei, Associate Professor, Ph.D., P.E. Zhixia Li, Ph.D. Student and Research Assistant Zhuo Yao, Ph.D. Student, Research Assistant Project RET is funded through NSF Grant # EEC-0808696