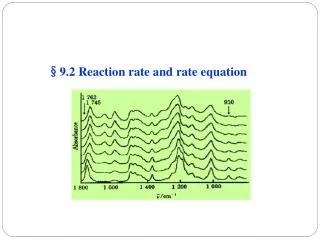
Download
1 / 15
160 likes | 186 Views
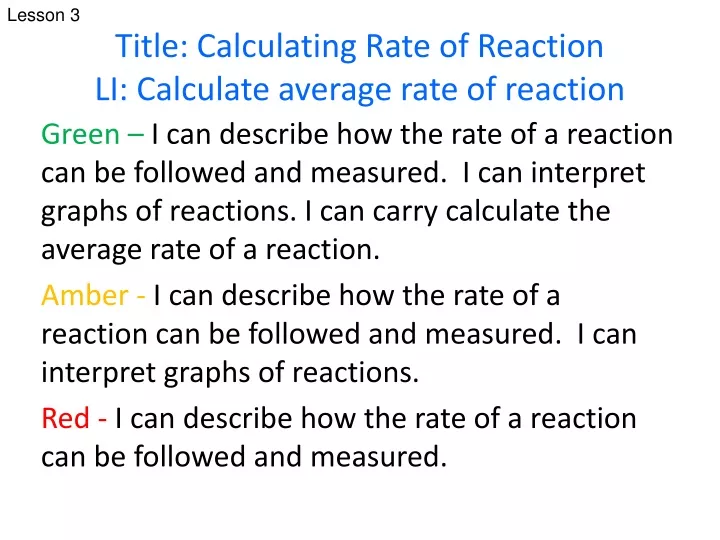
Lesson 3. Title: Calculating Rate of Reaction LI: Calculate average rate of reaction. Green – I can describe how the rate of a reaction can be followed and measured. I can interpret graphs of reactions. I can carry calculate the average rate of a reaction.

E N D
Lesson 3 Title: Calculating Rate of ReactionLI: Calculate average rate of reaction Green – I can describe how the rate of a reaction can be followed and measured. I can interpret graphs of reactions. I can carry calculate the average rate of a reaction. Amber - I can describe how the rate of a reaction can be followed and measured. I can interpret graphs of reactions. Red - I can describe how the rate of a reaction can be followed and measured.
Following the Progress of a Reaction using Graphs • Rate of the reaction • The steeper the slope the faster the reaction • Completion of the reaction • When the graph levels off the reaction has stopped • Usually one or both of the reactants has been used up
The graph shows how the volume of hydrogen gas produced increases with time when 2g of magnesium granules react with excess hydrochloric acid Add similar curves to the graph to show the reaction of the same concentration of acid and: A1g magnesium powder B 2g magnesium ribbon B A
Excess copper carbonate was added to 1 mol l-1 sulphuric acid at 25oC Add to the graph to show the curves obtained when the reaction is repeated: Aat a higher temperature Bwith the same volume of 0.5 mol l-1 sulfuric acid A B Booklet page 3
Average Rate of Reaction • Slope of graph tells us about the rate of the reaction • Rate = change in quantity (see data booklet) change in time From a graph: Rate = (change in y axis) (change in time)
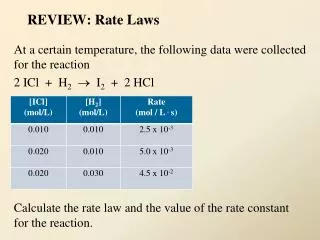
Calculating Average Rate Calculate the average rate between 0 and 90 seconds: Rate = change in quantity measured change in time Rate = 46 – 0 = 0.51 cm3 s-1 90 – 0 • Calculate the average rate between: • 60 and 120 seconds • 120 and 300 seconds
Monitoring Volume of Gas • Rate = change in volume time taken for change • Units of rate are cm3 i.e. cm3 s-1 s
Monitoring Mass of Gas • Rate = change in mass time taken for change • Units of rate are g i.e. g s-1 s
Calculating rate from a graph • Calculate the average rate of reaction between • 0-30 seconds • 30-90 seconds • 90-150 seconds • d) During which time interval is the rate fastest? • e) Explain why the rate of reaction is fastest during this time interval. Booklet page 4 and 5
PASS Before you leave… Answer the following: • Calculate the average rate between • 0s and 10s • 10s and 20s
Calculate the average rate between • 0s and 10s • 10s and 20s
Calculate the rate of reaction between • 0-4 minutes • 6-10 minutes 2