Download
1 / 43
430 likes | 435 Views
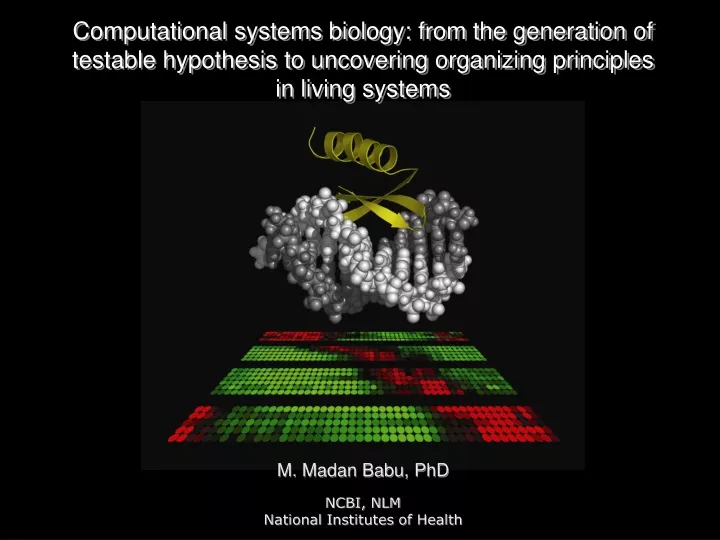
Computational systems biology: from the generation of testable hypothesis to uncovering organizing principles in living systems. M. Madan Babu, PhD. NCBI, NLM National Institutes of Health. 45,000,000 sequences from 160,000 organisms (EBI, NCBI). Sequence. 33,000 structures from

E N D
Computational systems biology: from the generation of testable hypothesis to uncovering organizing principles in living systems M. Madan Babu, PhD NCBI, NLM National Institutes of Health
45,000,000 sequences from 160,000 organisms (EBI, NCBI) Sequence 33,000 structures from 300 organisms (PDB, MSD) Structure 5,000 different conditions 20 organisms (ArrayExpress, SMD, GEO) Expression 100,000 interactions 5 organisms (Bind, DIP, publications) Interaction Explosion of information about living systems Major Challenge – Integration of information Generate experimentally testable hypothesis Uncover organizing principles of specific processes at the systems level
Regulation in Biological Systems Integration of data to generate testable hypotheses Discovery of sequence specific transcription factors in the malarial parasite Sequence, Structure, Expression and Interaction data provides convincing support Integration of data to uncover general organizing principles Introduction to transcriptional regulatory networks Integration of gene expression data reveals dynamics in transcriptional networks
5300 genes with over 700 metabolic enzymes Extensive complement of chromosomal regulatory proteins Extensive complement signaling proteins (GTPases, kinases) Previous comparative genomic analysis of eukaryotes suggested lack of detectable transcription factors in Plasmodium Complex life cycle Large number of genes www.cdc.gov Liver Mosquito RBC Human Mosquito Genes need to be regulated
AT-Hook Proteome of Plasmodium + ? SEG PF14_0633 Uncharacterized Globular domain ~60 aa Forkhead MADs bZIP AT-hook Homeo ARID Profiles & HMMs of known DBDs Possible explanations for the paradoxical observation Undetected transcription factors Distantly related or unrelated to known DNA binding domains Alternative regulatory mechanisms Chromatin-level regulation Post-translational modification RNA based regulation
. Plasmodium falciparum Plasmodium vivax . . + . . . . Cryptosporidium parvum Cryptosporidium hominis Non-redundant database Theileria annulata Lineage specific expansion in Apicomplexa Floral Homeotic protein Q (Triticum) + 49L, an endonuclease (X. oryzae phage Xp10) Profiles + HMM of this region Non-redundant database Globular region maps to AP2 DNA-binding domain Characterization of the globular domain – sequence analysis I
MAL6P1.287 (Plasmodium falciparum) + AP2 DNA-binding Domain from D. Psychrophila DP2593 Cgd6_1140/Chro.60146 (Cryptosporidium) Non-redundant database AP2 DNA-binding domain maps to the Globular region S1 S2 S3 H1 JPRED/PHD Sequence of secondary structure is similar to the AP2 DNA-binding domain Multiple sequence alignment of all globular domains Homologs of the conserved globular domain constitutes a novel family of the AP2 DNA-binding domain Characterization of the globular domain – sequence analysis II
Predicted SS of ApiAP2 H1 S1 S2 S3 S1 S2 S3 H1 SS of ATERF1 S1 S2 S3 H1 12 residues show a strong pattern of conservation and these are involved in key stabilizing hydrophobic interactions that determine the path of the backbone in the three strands and helix of the AP2 domain Core fold of the ApiAp2 domain will be similar to the plant AP2 DNA-binding domain A. thaliana ethylene response factor (ATERF1 - 1gcc – NMR structure) Binds GC rich sequences Characterization of the globular domain – structural analysis I
Changes in base-contacting residues suggest binding to AT-rich sequence W154 K156 R152 --- G5 (oxo group) T175 D/N --- A (amino group) G5 G21 R150 --- G20 (oxo group) S/T --- A (amino group) R152 W172 G20 C6 R150 C7 Charged residues in the insert may contact multiple phosphate groups to provide affinity R170 E160 S2 S3 G18 G17 Y186 W162 R147 ApiAp2 domain binds DNA in a sequence specific manner Characterization of the globular domain – structural analysis II
mRNA expression profiling Using microarray (sorbitol syncronization) Intra-erythrocyte developmental cycle DeRisi Lab Characterization of the globular domain – expression analysis I Complex life cycle Liver www.cdc.gov Mosquito RBC Human Mosquito RBC infection & merozoite burst
Co-expressed genes 22 Transcription factors Time points 0 46 46 Time points 0 Ring stage Trophozoite stage Average expression profile of all genes Early Schizont stage Schizont stage Striking expression pattern in specific developmental stages suggests that they could mediate transcriptional regulation of stage specific genes Characterization of the globular domain – expression analysis II
Protein (1267) Physical interaction (2846) Characterization of the globular domain – interaction analysis I Protein interaction network of P. falciparum Modified Y2H: Gal4 DBD + Protein + auxotrophic gene RNA isolated from mixed stages of Intra-erythrocyte developmental cycle Guilt by association Function of interacting neighbors provides clues about function of the protein LaCount et. al. Nature (2005)
Network of ApiAp2 proteins (97 interactions, 93 proteins) ApiAp2 proteins (13) Chromatin proteins (8) MAL8P1.153 (ES) 50% hypothetical Nucleosome assembly HMG protein Glycolytic enzymes Antigenic proteins Have a PPint domain Gcn5 PFD0985w (S) PF07_0126 (R) PF10_0075 (T) Guilt by association supports the role of ApiAp2 proteins to be involved in regulation of gene expression Characterization of the globular domain – interaction analysis II Protein interaction network of P. falciparum
Conclusion - I Integration of different types of experimental data allowed us to discover potential transcription factors in the Plasmodium genome Sequence Structure Expression Interaction Balaji S, Madan Babu M, Lakshminarayan Iyer, Aravind L Nucleic Acids Research (2005) Integration of data can generate experimentally testable hypotheses
Regulation in Biological Systems Integration of data to generate testable hypotheses Discovery of sequence specific transcription factors in the malarial parasite Sequence, Structure, Expression and Interaction data provides convincing support Integration of data to uncover general organizing principles Introduction to biological networks & transcriptional regulatory networks Integration of gene expression data reveals dynamics in transcriptional networks
Network Metabolic Protein Interaction Transcriptional Proteins Nodes Links Metabolites Transcription factor Target genes Enzymatic conversion Physical Interaction Transcriptional Interaction Protein-Protein Protein-Metabolite Interaction Protein-DNA A A A A B B B B Networks in Biology
Transcription factor Target gene Motifs (Local level) patterns of Interconnections Uri Alon & Rick Young Basic unit (Components) transcriptional interaction Scale free network (Global level) all transcriptional interactions in a cell Albert & Barabasi Structure of the transcriptional regulatory network Madan Babu M, Luscombe N, Aravind L, Gerstein M & Teichmann SA Current Opinion in Structural Biology (2004)
Local level: Transcriptional networks are made up of motifs which perform information processing task Global level: Transcriptional networks are scale-free conferring robustness to the system Properties of transcriptional networks
Single input Motif Multiple input Motif Feed Forward Motif ArgR TrpR TyrR Crp AroL AroM AraBAD ArgD AraC ArgE ArgF - Co-ordinates expression - Enforces order in expression - Quicker response - Integrates different signals - Quicker response Function - Responds to persistent signal - Filters noise Transcriptional networks are made up of motifs Network Motif “Patterns of interconnections that recur at different parts and with specific information processing task” Shen-Orr et. al. Nature Genetics(2002) & Lee et. al. Science (2002)
1 N (k) a g k Transcriptional networks are scale-free Scale-free structure Presence of few nodes with many links and many nodes with few links Scale free structure provides robustness to the system Albert & Barabasi, Rev Mod Phys (2002)
Tolerant to random removal of nodes (mutations) Vulnerable to targeted attack of hubs (mutations) – Drug targets Hubs are crucial components in such networks Scale-free networks exhibit robustness Robustness – The ability of complex systems to maintain their function even when the structure of the system changes significantly Haiyuan Yu et. al. Trends in Genetics (2004)
Summary I - Introduction Transcriptional networks are made up of motifs that have specific information processing task Transcriptional networks are scale-free which confers robustness to such systems, with hubs assuming importance Madan Babu M, Luscombe N et. al Current Opinion in Structural Biology (2004)
Cell cycle Static network Sporulation Across all cellular conditions Stress Dynamic nature of the regulatory network in yeast How are the networks used under different conditions? Are there differences in the sub-networks under different conditions?
Individual experiments TRANSFAC DB + Kepes dataset ChIp-chip experiments Snyder lab + Young lab 288 genes + 477 genes 356 interactions + 906 interactions 1560 genes + 2416 gene 2124 interactions + 4358 interaction 3,962 genes (142 TFs +3,820 TGs) 7,074 Regulatory interactions Dataset - gene regulatory network in Yeast
Transcription Factors Gene expression data for 5 cellular conditions Cell-cycle Sporulation DNA damage Diauxic shift Stress Target Genes 142 TFs 1,808 TGs 4,066 Interactions 1 condition 4 conditions 2 conditions 5 conditions 3 conditions Integrating gene regulatory network with expression data 142 TFs 3,820 TGs 7,074 Interactions
Active sub-network Gene regulatory network Identify differentially regulated genes Find TFs that regulate the genes Find TFs that regulate these TFs Back-tracking method to find active sub-networks
Active sub-networks: How different are they ? Stress Binary Processes Diauxic shift DNA damage Cell cycle Sporulation Multi-stage processes
Single Input Motif (SIM) – 23% Multi-Input Motifs (MIM) – 50% Feed-forward Motif (FF) – 27% Network Motifs Milo et.al (2002), Lee et.al (2002)
Sub-networks : Network motifs Network motifs are used preferentially in the different cellular conditions
Cell cycle Sporulation Diauxic shift DNA damage Stress Condition specific networks are scale-free • Do different proteins become hubs under different conditions? • Is it the same protein that acts as a regulatory hub?
Cluster TFs according to the number of target genes active in each condition Different TFs become key regulators in different conditions Regulatory hubs change with conditions
Hubs regulate other hubs to initiate cellular events Suggests a structure which transfers weight between hubs to trigger cellular events
Connectivity Path length Clustering coefficient Network Parameters
Incoming connections = 2.1 on average, each gene is regulated by ~2 TFs Remains constant Outgoing connections = 49.8 on average, each TF regulates ~50 genes Changes Network Parameters - Connectivity
Binary: Quick, large-scale turnover of genes Multi-stage: Controlled, ticking over of genes at different stages Network parameters : Connectivity • “Binary conditions” • greater connectivity • “Multi-stage conditions” • lower connectivity
1 intermediate TF Network Parameters – Path length Number of intermediate TFs until final target Starting TF Final target Indication of how immediate a regulatory response is Average path length = 4.7 Path length = 1
Binary Multi-stage Network parameters : Path length • “Binary conditions” • shorter path-length • “faster”, direct action • “Multi-stage” conditions • longer path-length • “slower”, indirect action • intermediate TFs regulate different stages
Network Parameters – Clustering coefficient Ratio of existing links to maximum number of links for neighboring nodes 4 neighbours Measure of inter-connectedness of the network 1 existing link Average coefficient = 0.11 6 possible links Clustering coefficient = existing links/possible links = 1/6 = 0.17
Binary Multi-stage Network parameters : Clustering coeff • “Binary conditions” • smaller coefficients • less TF-TF inter-regulation • “Multi-stage conditions” • larger coefficients • more TF-TF inter-regulation
multi-stage conditions binary conditions • more target genes • shorter path lengths • less inter-regulation • between TFs • fewer target genes • longer path lengths • more inter-regulation • between TFs Sub-networks have evolved both their local structure and global structure to respond to cellular conditions efficiently
Implications First overview of the dynamics of the transcriptional regulatory network of a eukaryote Provides insights into engineering regulatory interactions Methods developed to reconstruct and compare active networks are generically applicable Identification of key regulatory hubs under different conditions can serve as good drug targets
Conclusions - II Network motifs are preferentially used under the different cellular conditions and different proteins act as regulatory hubs in different cellular conditions Sub-networks have evolved both their local structure and global structure to respond to cellular conditions efficiently Luscombe N, Madan Babu M et. al Nature (2004) Integration of data can uncover organizing principles in living systems
Acknowledgements Aravind Balaji Lakshminarayan Haiyuan Yu Mike Snyder Mark Gerstein Nick Luscombe Sarah Teichmann National Center for Biotechnology Information National Institutes of Health MRC Laboratory of Molecular Biology