Download
1 / 10
100 likes | 110 Views
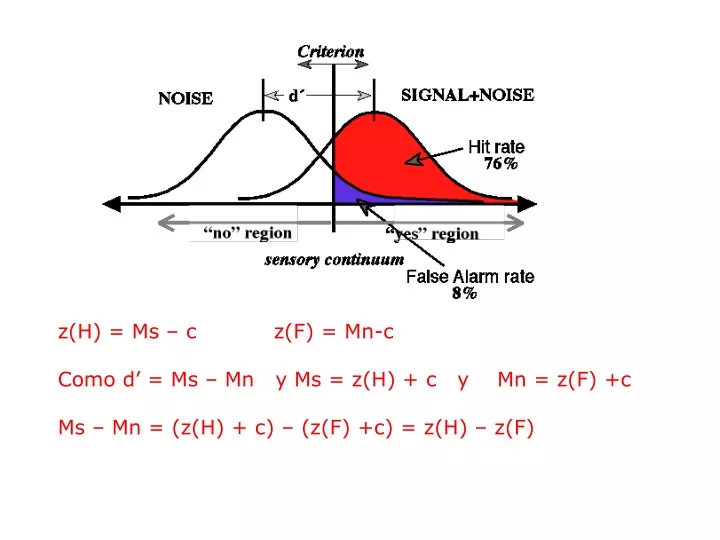
z(H) = Ms – c z(F) = Mn-c Como d’ = Ms – Mn y Ms = z(H) + c y Mn = z(F) +c Ms – Mn = (z(H) + c) – (z(F) +c) = z(H) – z(F). C = -1/2 [z(H) + z(F)] Por que el punto medio implica Ms = -Mn. Relación entre c y β : ln ( β ) = cd’.

E N D
z(H) = Ms – c z(F) = Mn-c Como d’ = Ms – Mn y Ms = z(H) + c y Mn = z(F) +c Ms – Mn = (z(H) + c) – (z(F) +c) = z(H) – z(F)
C = -1/2 [z(H) + z(F)] Por que el punto medio implica Ms = -Mn
Relación entre c y β: ln (β) = cd’
Criterion location measures index bias by measuring the distance between the decision criterion and the intersection of the two stimulus distributions. Likelihood ratio measures index bias by measuring the relative height of the two distributions at the decision criterion. The lack of empirical support favoring one family of bias measures is surprising, because the isobias functions predicted by criterion location measures clearly differ from those predicted by likelihood ratio measures.
Isobias functions plot the combinations of hit and false alarm rates that yield the same numerical value for a particular measure of bias.