Download
1 / 86
910 likes | 1.12k Views
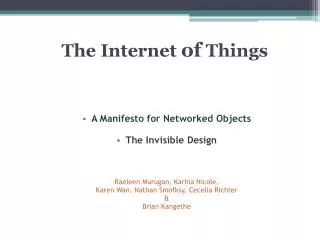
Presentation to MUBIN (March 6, 2016)

E N D
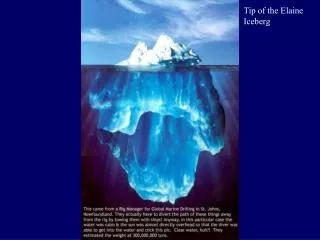
INTERNET OF THINGS - THE TIP OF AN ICEBERG - DR. MAZLAN ABBAS REDTONE IOT March 6, 2016 MUBIN “How much more IOT can do is only left to your imagination and to your budget. You can do as little or as much with IoT as you want.”
TECHNOLOGIES THAT ENABLE IOT IPv6 Cheap sensors (50% cheaper) For the Past 10 Years Cheap bandwidth (40x cheaper) Big data (unstructured data) Ubiquitous wireless coverage (free wifi) Cheap processing & smarter (60x cheaper) Smartphones (personal gateway)
History of Internet of Things
KEVIN ASHTON – “FATHER OF THE IOT” “So you get stuff like the smart wine bottle, the smart bikini, and the smart water bottle. This stuff is not the Internet of Things – this stuff is all rubbish.” He believed IoT could “turn the world into data” that could be used to make macro decisions on resource utilization. “Information is a great way to reduce waste and increase efficiency, and that’s really what the Internet of Things provides” [Source: The Reimagination Thought Leaders Summit ,Sydney, 17 November 2015]
TO OVERCOME 3 KEY CHALLENGES Automating the collection of data Integrating data from multiple sources Analyzing data to effectively identify actionable insights
IOT ECOSYSTEM Remote Analytics / Data Storage Command / RFI IoT Devices Analysis Internet Gateway
HOW BIG IS THE IOT MARKET? 63 devices connected every second By 2016 Gartner predicts 6.4 billion devices will be connected to the internet -- and 5.5 million new 'things' will join them each day.
SIZING THE MARKET – YEAR 2020 34 BILLION There will be 24 Billion IoT devices and 10 Billion traditional computing devices [Source: Business Insider, 2016]
MARKET OPPORTUNITY Application Development Device Hardware System Integration Amount Spent 2015- 2020 Data Storage Security Connectivity $ 2 $ 3 $ 0 $ 1 USD (Trillions)
3 MARKET ENTITIES Consumers Businesses Government 5B Devices Installed By 2020 7.7B Devices Installed By 2020 11.2B Devices Installed By 2020 • • • $900M Spent (2015- 2020) $2.1B Spent (2015- 2020) $3B Spent (2015-2020) • • • $400 ROI (2015-2025) $4.7B ROI (2015-2025) $7.6B ROI (2015-2025) • • •
ENVIRONMENTS Manufacturing 35% of manufacturers already use smart sensors. 10% plan to implement them within a year, and 8% plan to implement them within 3 years, according to PwC Oil, gas, and mining 35% of manufacturers already use smart sensors. 10% plan to implement hem within a year, and 8% plan to implement them within 3 years, according to PwC Transportation Connected cars are a top IoT device. We estimate there will be over 220M connected cars on the road by 2020. Insurance 35% of manufacturers already use smart sensors. 10% plan to implement hem within a year, and 8% plan to implement them within 3 years, according to PwC Defense We estimate spending on drones will reach $8.7B in 2020. In addition, 126K military robots will be shipped in 2020, according to Frost & Sullivan. Connected Home 35% of manufacturers already use smart sensors. 10% plan to implement hem within a year, and 8% plan to implement them within 3 years, according to PwC Agriculture We estimate 75M IoT devices will be shipped for agricultural uses in 2020, at a 20% CAGR. These devices are primary sensors placed in soil to track acidity levels, temperature, and variables that help farmers increase crop yields. Food Services 35% of manufacturers already use smart sensors. 10% plan to implement hem within a year, and 8% plan to implement them within 3 years, according to PwC
ENVIRONMENTS Infrastructure We estimate municipalities worldwide will increase their spending on IoT systems at a 30% CAGR, from $36B in 2014 to $133B in 2019. This investment will generate $421B in economic value for cities worldwide in 2019. Utilities Energy companies throughout the world are trying to meet the rising demand in energy. To do this, they will be installing nearly 1 B smart meters by 2020. Retail Beacons, paired with mobile apps, are being used in stores to monitor customer behavior and push advertisements to customers. In the US, we estimate $44.4B will be generated from beacon triggered messages. Hospitality 31% of hotels use next-generation door locks, 33% have room control devices, 16% have connected TVs, and 15% use beacons throughout the hotel, according to Hospitality Technology’s 2015 Lodging Technology survey. Logistics Tracking sensors placed on parcels and shipping containers will help reduce costs associated to lost or damaged goods. In addition, robots such as Amazon Kiva robot, help reduce labor costs in warehouses. Healthcare We estimate 646M IoT devices will be used for healthcare by 2020. Connected healthcare devices can collect data, automate processes, and more. But these devices can also be hacked, thereby posing a threat to the patients who rely on them. Banks There are nearly 3M ATMs installed globally in 2015, according the World Bank. Some teller- assist ATMs provide live-stream video of a teller for added customer support. Smart Buildings 43% of building managers in the US believe the IoT will affect how they run their building within the next 2 to 3 years, according to a survey from Daintree Networks.
IOT – BASICS TO ADVANCED SERVICES Monitor Autonomous Control Optimize
IOT BENEFITS Reduce Costs Improve Efficiency Create Innovative Products New Revenue Streams
IOT APPLICATIONS - SIGNS OF FAILURE Manufacturing Plants Power Plants Social Infrastructures Networks Quality in trains and aircrafts etc
IOT APPLICATIONS - FORECASTING Churn Management Product Demand Power Demand Quality Deterioration Fair Price
WHAT ARE THE BUSINESS CHALLENGES Fragmented industry Security and Privacy of data Managing vast amounts of data Finding the right business model
WHAT-IF – WE CAN DO DATA BLENDING Waste Home Health Transport Office Creating New Compound Applications
THE GOLD RUSH MAKING SENSE OF DATA … BUT WHAT CITY DATA?
VALUE IS CREATED BY MAKING SENSE OF DATA Wisdom More Important Evaluated understanding WHY Appreciation of Understanding Knowledge Answers to questions. HOW Answers to WHO WHAT Information questions WHEN WHERE Less Symbols Data Important VALUE PYRAMID
EXAMPLE – FLOOD MONITORING Wisdom More Important N/A Why is the water rising? Understanding How to control the water level? How fast is the water rising? Knowledge What is the water level in the river? When does the river swell up? Where is the location of water rise? Who control the water dam? Information Less Data 12-inch, 8mm etc Important Who Benefits? - Citizens / Emergency Centers / Environmental
BENEFITS OF SENSING-AS-A-SERVICE Single Infrastructure • Multiple Usage Harnessing the Creativity Rapid Deployment Assisting Scientific Community Sustainable Business Model IOT Cloud
SMART HOME SCENARIO – INTERACTIONS IN SENSING-AS-A-SERVICE MODEL [Source: “Sensing as a Service Model for Smart Cities Supported by Internet of Things”, CharithPereraet. al., Transactions on Emerging Telecommunications Technology, 2014]
EFFICIENT WASTE MANAGEMENT IN SMART CITIES SUPPORTED BY THE SENSING-AS-A- SERVICE [Source: “Sensing as a Service Model for Smart Cities Supported by Internet of Things”, CharithPereraet. al., Transactions on Emerging Telecommunications Technology, 2014]
CITIZENS AS THE “SENSORS” GETTING INSIGHTS FROM CROWDSENSING
SMARTPHONE AS “SENSING ASSISTANT” Sensors: ? Camera – “Eyes” ? Audio – “Ears” ? Accelerometer – “Speed” ? GPS – “Location” ? Gyroscope – “Movement” ? Compass – “Direction” ? Proximity – “Closeness” ? Ambient light – “Eyes” ? Others…
NOISETUBE – CROWDSOURCING OF POLLUTION DATA USING SMARTPHONES. WHAT MOTIVATES? Citizens and Communities concerned with noise • Measure your daily sound exposure in dB(A) with your mobile phone • Tag noisy sources to inform the community about them • Visualize and contribute your measurements on a • Compare your experience Local governments / city planners • Improve decision-making by understanding local and global noise pollution in your city using maps and statistics • Get immediate feedback and opinions to and from citizens Researchers • Get access to and analyze (anonymized) collective noise data • Find out what is important in soundscape perception Developers • Use the environmental sensor web API to do your own web mash-ups • • • •
CrowdMag 1. Combining it with magnetic data from other sources, we hope to create near- real-time models of Earth's time changing magnetic field to aid navigation. 2. Mapping static magnetic noise sources (for e.g. power transformer and iron pipes) could potentially improve accuracy of the magnetic navigation systems.
HOW-TO HOW-TO PROVIDE A SMART CITY SOLUTIONS?
FIVE BIG REASONS WE FOCUS ON CITIES 1. 2. 3. 4. More than half the world lives in cities. By 2050, 70% of the world’s population will live in cities. More than 60% of cities have yet to be built. Cities have been the center of civilization, life, and knowledge for centuries. Cities are at the forefront of global innovation. 5.
CITIES WILL BE THE ENGINE OF OUR ECONOMY Better usage of public resources Quality of Life Reduce operational costs
HOW DO WE MEASURE OUR CITY? “WHAT IS OUR CITY’S HEALTH INDEX?”
What is Your Pulse Rate? WHAT-IF YOU CAN CAPTURE MORE THAN YOUR PULSE RATE?
Life-Logging The 150 Days of My Life
HOW-TO HOW-TO PROVIDE A SMART CITY SOLUTIONS?
BUILDING 3 TYPES OF CITIES ROI-driven Carbon-driven Vanity-driven
DATA OWNERSHIPS Personal / Household Private Public Commercial Sensor Data Provider
WHAT-IF – WE CAN DO DATA BLENDING Waste Home Health Transport Office Creating New Compound Applications