Download
1 / 4
40 likes | 109 Views
Supplementary Fig. S1. 2 nd ChIP. 1 st ChIP. Pol II. 7. Snf1. 6. 7. Occupancy ADH2 promoter/telomer. 5. 6. Occupancy ADH2 promoter/telomer. *. 4. 5. 3. 4. 2. 3. 1. 2. ns. 0. 1. R. 1h. 0. R. 1h.

E N D
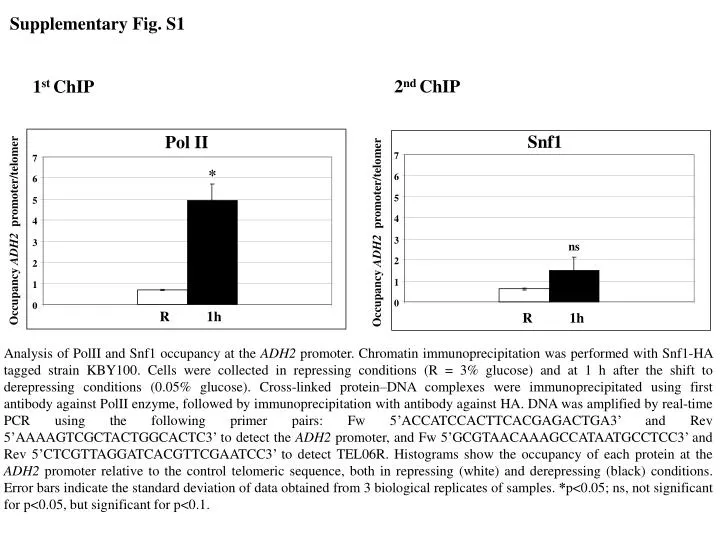
Supplementary Fig. S1 2nd ChIP 1st ChIP Pol II 7 Snf1 6 7 Occupancy ADH2 promoter/telomer 5 6 Occupancy ADH2 promoter/telomer * 4 5 3 4 2 3 1 2 ns 0 1 R 1h 0 R 1h Analysis of PolII and Snf1 occupancy at the ADH2 promoter. Chromatin immunoprecipitation was performed with Snf1-HA tagged strain KBY100. Cells were collected in repressing conditions (R = 3% glucose) and at 1 h after the shift to derepressing conditions (0.05% glucose). Cross-linked protein–DNA complexes were immunoprecipitated using first antibody against PolII enzyme, followed by immunoprecipitation with antibody against HA. DNA was amplified by real-time PCR using the following primer pairs: Fw 5’ACCATCCACTTCACGAGACTGA3’ and Rev 5’AAAAGTCGCTACTGGCACTC3’ to detect the ADH2 promoter, and Fw 5’GCGTAACAAAGCCATAATGCCTCC3’ and Rev 5’CTCGTTAGGATCACGTTCGAATCC3’ to detect TEL06R. Histograms show the occupancy of each protein at the ADH2 promoter relative to the control telomeric sequence, both in repressing (white) and derepressing (black) conditions. Error bars indicate the standard deviation of data obtained from 3 biological replicates of samples. *p<0.05; ns, not significant for p<0.05, but significant for p<0.1.
Pol II Snf1 Gal83 7 7 6 6 * 5 5 * 4 4 Occupancy ACS1 promoter/telomer Occupancy ACS1 promoter/telomer * 3 3 2 2 1 1 0 0 1h R 1h R R 1h Supplementary Fig. S2 1st ChIP 2nd ChIP Analysis of Snf1, Gal83 and PolII occupancy at the ACS1 promoter. Chromatin immunoprecipitation was performed with Snf1-HA KBY100 and Gal83-HA KBY98 strains. Cells were collected in repressing conditions (R = 3% glucose) and at 1 h after the shift to derepressing conditions (0.05% glucose). Cross-linked protein–DNA complexes were immunoprecipitated using first antibody against PolII enzyme, followed by immunoprecipitation with antibody against HA. DNA was amplified by real-time PCR using the following primer pairs: Fw 5’CACTCACCTGTTGACATGCC3’ and Rev5’ TATTTGCCACCGAGGAACTGT3’ to detect the ACS1 promoter, and Fw 5’GCGTAACAAAGCCATAATGCCTCC3’ and Rev 5’CTCGTTAGGATCACGTTCGAATCC3’ to detect TEL06R. Histograms show the occupancy of each protein at the ACS1 promoter relative to the control telomeric sequence, both in repressing (white) and derepressing (black) conditions. Error bars indicate the standard deviation of data obtained from 3 biological replicates of samples. *p<0.05.
Supplementary Fig. S3 Gcn5-Myc Rpd3-Myc Analysis of Gcn5 and Rpd3 occupancy at the ADH2 promoter. Chromatin immunoprecipitation was performed with Gcn5-myc tagged SNF1 and snf1 deletion mutant strains (KBY95 and KBY105, respectively) and Rpd3-myc tagged SNF1 and snf1 deletion mutant strains (KBY97 and KBY107, respectively). Cells were collected in repressing conditions (R = 3% glucose) and at 1 h after the shift to derepressing conditions (0.05% glucose). Cross-linked protein–DNA complexes were immunoprecipitated using antibody against c-myc. DNA was amplified by real-time PCR using the following primer pairs: Fw 5’GAGTGCCAGTAGCGACTTTTT3’ and Rev 5’ACTTGCCGTTGGATTCGTAG3’ to detect the ADH2 promoter, and Fw 5’GCGTAACAAAGCCATAATGCCTCC3’ and Rev 5’CTCGTTAGGATCACGTTCGAATCC3’ to detect TEL06R. H. Histograms show the occupancy of each protein at the ADH2 promoter relative to a control telomeric sequence, both in repressing (white) and derepressing (black) conditions. Error bars indicate the standard deviation of data obtained from 3 biological replicates of samples.
Supplementary Fig. S4 Gcn5-Myc Rpd3-Myc Analysis of Gcn5 and Rpd3 occupancy at the ACS1 promoter. Chromatin immunoprecipitation was performed with Gcn5-myc tagged SNF1 and snf1 deletion mutant strains (KBY95 and KBY105, respectively) and Rpd3-myc tagged SNF1 and snf1 deletion mutant strains (KBY97 and KBY107, respectively). Cells were collected in repressing conditions (R = 3% glucose) and at 1 h after the shift to derepressing conditions (0.05% glucose). Cross-linked protein–DNA complexes were immunoprecipitated using antibody against c-myc. DNA was amplified by real-time PCR using the following primer pairs: Fw 5’TCGGTGGCAAATAGTTCTCC3’ and Rev 5’AGAGGGCGACATAGCACAGT3’ to detect the ACS1 promoter, and Fw 5’GCGTAACAAAGCCATAATGCCTCC3’ and Rev 5’CTCGTTAGGATCACGTTCGAATCC3’ to detect TEL06R. H. Histograms show the occupancy of each protein at the ACS1 promoter relative to a control telomeric sequence, both in repressing (white) and derepressing (black) conditions. Error bars indicate the standard deviation of data obtained from 3 biological replicates of samples.


![[Fig. S1]](https://cdn3.slideserve.com/6448662/slide1-dt.jpg)

