Download
1 / 22
220 likes | 322 Views
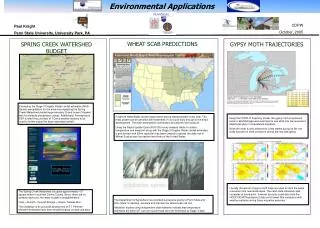
Modeling Aerosol Formation and Transport in the Pacific Northwest with the Community Multi-scale Air Quality (CMAQ) Modeling System. Susan M. O'Neill Fire and Environmental Applications (FERA) Team USDA Forest Service Seattle, WA. The NorthWest Regional Modeling Center (NWRMC).

E N D
Modeling AerosolFormation and Transport in the Pacific Northwest with the Community Multi-scale Air Quality (CMAQ) Modeling System Susan M. O'Neill Fire and Environmental Applications (FERA) Team USDA Forest Service Seattle, WA
The NorthWest Regional Modeling Center (NWRMC) • Collaborators: EPA Region X, WSU, States of Washington, Oregon, and Idaho, and Canada • Study Period: July 3-15,1996 • 12 km Domain: Washington, Oregon, Idaho, SW Canada • Two Emission Inventories • NET96, BEIS2 • NWRMC, GLOBEIS • Chemical Mechanism: RADM2_CI4_AE2_AQ
Emission Inventory Summary Biogenic VOC emissions are 2.8 times higher in the NWRMC EI MBO (lumped into OLT) accounts for 14% of the VOC’s in the NWRMC Terpene emissions are 4 times higher in the NWRMC Anthropogenic NH3 emissions are 7.8 times higher in the NET96 EI
Results - Aerosol Concentrations • Compare 2 CMAQ solutions with 12 IMPROVE Station Measurements for: • Total PM2.5 • Inorganic PM2.5 - SO4, NO3, (NH4) • Influence of molar ratio of[NH3 + NH4]/[SO4] • Organic PM2.5 • Visibility • Aerosol Concentrations at the Columbia River Gorge (CRG).
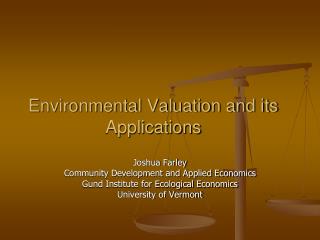
NET96 NWRMC R^2 0.32 0.43 Index 0.54 0.50 Bias (%) -15 93 Error (%) 49 98 NWRMC Total PM2.5 NET96 (July 14, 1996, 7am) NWRMC: PM2.5 < 20µg/m3 for much of period, then up to 35 µg/m3 in CRG, Olympics and Central Idaho. NET96: Similar in trend to NWRMC but lower concentrations. Similar hot spots in Portland (45 µg/m3)/CRG and Olympics but not in Central Idaho. (July 14, 1996, 7am)
Inorganic Aerosols SO2 NO3 NET96 NWRMC NET96 NWRMC R^2 0.18 0.04 0.56 0.56 Index 0.49 0.39 0.57 0.61 Bias (%) -47 86 -5 -72 Error (%) 65 105 104 76 NWRMC NET96 (July 14, 1996, 7am) Inorganics impact the Urban corridor west of the Cascades with some advection through the CRG. Urban effect much more pronounced in the NET96, especially at Portland with concentrations up to 15 ug/m^3 Little diurnal variation of inorganics on a domain average. (NWRMC = 1.3 ug/m^3, NET96 = 0.15 ug/m^3) (July 14, 1996, 7am)
NWRMC Ratio: [NH4+NH3]/SO4 NWRMC: Ratio varied about 1 SO4 Formation Dominates Little NO3 Formation NET96: Ratio >= 2 Excess Ammonia NO3 Formation July 14, 1996, 7am NET96 (July 14, 1996, 7am) Given the order of magnitude difference in ammonia emissions, “reality” lies in between. Measurements of ammonia and an ammonia emissions model are critical to validation/understanding of the inorganic chemistry. (July 14, 1996, 7am)
Organic Aerosols NET96 NWRMC R^2 0.57 0.62 Index 0.69 0.81 Bias (%) -2 44 Error (%) 35 54 NWRMC NET96 (July 14, 1996, 7am) Peak PM2.5 concentrations correspond to peak concentrations of organic aerosols. Organic aerosol concentrations peak in the morning hours due to terpene emissions, chemistry & meteorology. Regional hot spots: CRG & Olympics - Anthropogenic Idaho - Biogenic (July 14, 1996, 7am)
Visibility • In rural areas, scattering of light by aerosol particles accounts for up to 95% of the total light extinction. • Reconstructed extinction coefficient (bext) calculated by:bext = 0.003 * f(rh) * {[ammonium sulfate] + [ammonium nitrate]} + 0.004 * [organic aerosol mass] + 0.01 * [elemental carbon] + 0.001 * [fine soil] • The deciview (dv) linearizes the extinction coefficient:dv = 10 ln(bext/10), where bext is in units of 1/Mm
Deciview NET96 NWRMC R^2 0.39 0.63 Index 0.53 0.77 Bias (%) -25 -1 Error (%) 30 17 NWRMC NET96 (July 14, 1996, 7am) NWRMC performed better for all statistics. Visibility impairment in the NET96 solution tended to lie west of the Cascades or occur near urban areas. Both solutions tended to under-predict visibility degradation (July 14, 1996, 7am)
Summary • This is the first step in a comprehensive performance evaluation of CMAQ for the Pacific Northwest. • Two Emission Inventories produced two sets of solutions • order of magnitude difference in NH3 emissions • 3 times greater VOC emissions in NWRMC EI • Compared the two solutions with measurements at 12 IMPROVE sites. • NWRMC solution tended to over-predict PM2.5 (bias = 93%) and the NET96 solution tended to under-predict PM2.5 (bias = -15%) • NWRMC tended to over-predict SO4 and under-predict NO3 • NET96 tended to under-predict SO4 and performed well for NO3 • Maximum PM2.5 concentrations correspond to peak organic aerosol concentrations. • The NWRMC solution performs well predicting light extinction while the NET96 solution under-predicts light extinction.
Recommendations • Model Development • Improve treatment of organics in aerosol chemistry • account for different terpene specie yields • organics can modify the water chemistry • Account for course mode aerosols in extinction calculation • Incorporate NaCl chemistry • Transfer accumulation mode mass to course mode (NH4, OC, NO3) • Include crustal species - significant in areas with airborne dust
Recommendations (cont) • Emission Inventory Development • Include emissions from: wind-blown dust, field burning, prescribed fires • Investigate Biogenic emissions • NH3 • Two EI solutions presented - “reality” lies inbetween • NH3 Emissions Model • Include NH3 from Oceans • Sensitivity Analysis • Investigate interdependencies of PM and ozone formation • Do smaller grid scale studies
Acknowledgements • States of Oregon, Idaho, Washington - Emission Inventory Development • EPA Region X - Jeff Arnold, Rob Wilson, Bill Puckett • Canada – Colin Di Cenzo, Weimin Jiang • Washington State University • Brian Lamb, Shelley Pressley, Jack Chen • Dennis Finn and Candis Claiborn – Spokane Health Effects Data • NCAR - Alex Guenther - GLOBEIS • PNNL - Guangfeng Jiang – Chemistry Expertise
EC NET96 NWRMC R^2 0.73 0.79 Index 0.57 0.60 Bias (%) 42 78 Error (%) 72 85
Fine Soil NET96 NWRMC R^2 -0.10 0.21 Index 0.14 0.48 Bias (%) 152 -50 Error (%) 172 69