Download
1 / 28
280 likes | 419 Views
To create your Data & Statistics Album, you will need 4 sheets computer paper, a pencil, and scissors. ***This will be your Study Guide for Unit 10! It will be turned in for a quiz grade. Fold all 4 sheets of paper in half hamburger style.

E N D
To create your Data & Statistics Album, you will need 4 sheets computer paper, a pencil, and scissors.***This will be your Study Guide for Unit 10! It will be turned in for a quiz grade. • Fold all 4 sheets of paper in half hamburger style.
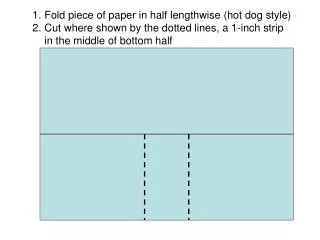
2. On 1 sheet of paper, still folded, start approximately 1 inch from the bottom of the fold. Make a very slender cut to the top, ending approximately 1 inch from the top. Folded Side Spaghetti Thin Cut (leave 1 in. at top and bottom)
3. Place the cut sheet of paper on top of the remaining 3 folded sheets. Using your pencil, lightly mark the start and end points of your spaghetti thin cut. Folded Side
4. Keeping the 3 bottom sheets of paper together, cut along the fold to the points marked on your paper. Cut along the fold to the mark. Cut along the fold to the mark.
5. Open the 3 folded sheets, and lightly bend them in half hotdog style.
7. Gently open the 3 pages, allowing the top and bottom cuts to align with the corresponding parts of the remaining sheet.
6. Gently slide the papers through the opening created by the spaghetti thin cut of the other paper. Slide the 3 pages through the opening.
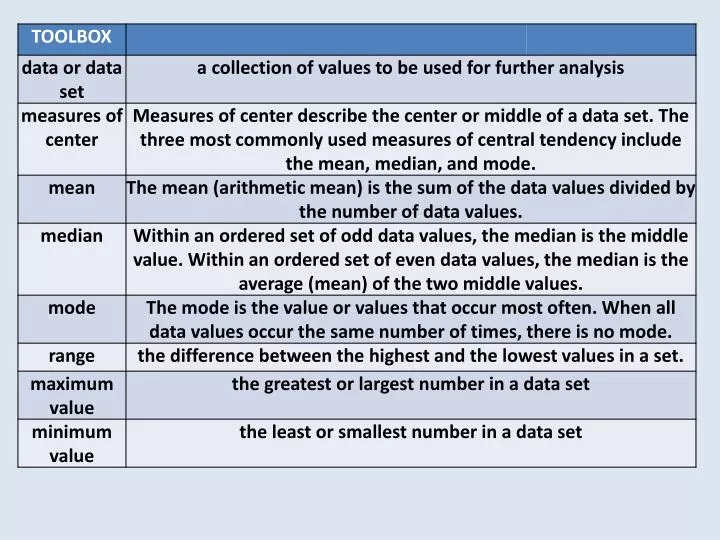
Daily High Temperatures (for any given date) Over the Last Decade Mean - (or average) the sum of a set of data divided by the number of data To find the mean, find the sum of the data 59+50+50+13+40+46+50+53+58+57=465 and divide it by the number of data. 465÷10=46.5 The mean for daily high temperature over the last decade is 46.5°, or approximately 47°.
Daily High Temperatures (for any given date) Over the Last Decade Median - the middle value of a data set To find the median, place all the data in numerical order, then find the middle number. If there are two middle numbers, find the mean (or average) of the two middle numbers. 13 40 46 47 49 50 50 53 58 59 49+50=99 99÷2=49.5
Daily High Temperatures (for any given date) Over the Last Decade Mode - the most common value in a data set To find the mode, find the most common value. It helps to place data in numerical order to find the mode. 13 40 46 47 49 50 50 53 58 59 If there is not a value which appears more often than another, then there is no mode.
Daily High Temperatures (for any given date) Over the Last Decade Range - the difference between the greatest and the least values in a data set To find the range of the daily high temperatures, subtract the least value from the greatest value. 59° - 13° = 46°
3, 2, 1 SUMMARY-Name : 3 Things you know about mean, median or mode 2 Things you want to know more about measures of central tendency 1 Thing that you don’t understand. Homework: Work on Study Guide Math 7-Workbook page 2 Math 7+ Workbook pages 45, 46 Study for Unit test on Wednesday