Download
1 / 33
330 likes | 470 Views
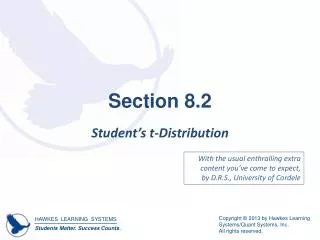
Section 8.2. Student’s t-Distribution. With the usual enthralling extra content you’ve come to expect, by D.R.S., University of Cordele. Student’s t -Distribution. Properties of a t -Distribution 1. A t -distribution curve is symmetric and bell-shaped, centered about 0.

E N D
Section 8.2 Student’s t-Distribution With the usual enthralling extra content you’ve come to expect, by D.R.S., University of Cordele
Student’s t-Distribution Properties of a t-Distribution 1. A t-distribution curve is symmetric and bell-shaped, centered about 0. 2. A t-distribution curve is completely defined by its number of degrees of freedom, df. 3. The total area under a t-distribution curve equals 1. 4. The x-axis is a horizontal asymptote for a t-distribution curve.
HAWKES LEARNING SYSTEMS math courseware specialists Continuous Random Variables 6.5 Finding t-Values Using the Student t-Distribution Comparison of the Normal and Student t-Distributions: A t-distribution is pretty much the same as a normal distribution! There’s this additional little wrinkle of “d.f.”, “degrees of freedom”. Slightly different t distributions for different d.f.; higher d.f. is closer & closer to the normal distribution.
Why bother with t ? If you don’t know the population standard deviation, σ, but you still want to use a sample to find a confidence interval. t builds in a little more uncertainty based on the lack of a trustworthy σ. The plan: This lesson – learn about t and areas and critical values, much like we have done with z. Next lesson – doing confidence intervals with t.
Why bother with t ? Observe in the picture how t isn’t quite as high and bold in the middle part of the bell curve. The uncertainty shows up as extra area in the tails of the bell curve. As the sample size n gets larger,the degrees of freedom d.f. gets larger,and the uncertainty becomes less uncertain,and the t bell curve gets very much closer to the normal distribution bell curve we use in z problems. History of t : Q.A. at an Irish brewery circa 1900. See textbook or internet for all the details.
Example 8.9: Finding the Value of tα Find the value of t0.025 for the t-distribution with 25 degrees of freedom. Solution The number of degrees of freedom is listed in the first column of the t-distribution table. Since the t-distribution in our example has 25 degrees of freedom, the value we need lies on the row corresponding to df = 25.
Example 8.9: Finding the Value of tα(cont.) Looking at the value of the subscript on t, which is the area in the right tail, 0.025, tells us to use the column for an area of 0.025 in one tail. This row and column intersect at 2.060. Thus, t0.025 = 2.060.
Example 8.10: Finding the Value of t Given the Area to the Right Find the value of t for a t-distribution with 17 degrees of freedom such that the area under the curve to the right of t is 0.10.
Example 8.10: Finding the Value of t Given the Area to the Right (cont.) Solution Note that according to the picture, the area under the curve to the right of t is 0.10. This means that α= 0.10. We are told that the distribution has 17 degrees of freedom. Looking across the row for df = 17 and down the column for an area in one tail of 0.100 we see that t0.10 = 1.333.
Example 8.10: Finding the Value of t Given the Area to the Right (cont.) *
Example 8.11: Finding the Value of t Given the Area to the Left Find the value of t for a t-distribution with 11 degrees of freedom such that the area under the curve to the left of t is 0.05.
Example 8.11: Finding the Value of t Given the Area to the Left (cont.) Solution Because the t-distribution is symmetric, we can look up the t-value for an area of 0.05 under the curve to the right of t. Using the table, we get t0.05 = 1.796.
Example 8.11: Finding the Value of t Given the Area to the Left (cont.) *
Example 8.11: Finding the Value of t Given the Area to the Left (cont.) However, since the given area is to the left of t, the t-value needs to be negative. So, for this example, -t0.05 = -1.796. Some TI-84 Plus Silver Edition calculators can also be used to find the t-value. • Press and then to go to the DISTR menu. • Choose option 4:invT(.
Example 8.11: Finding the Value of t Given the Area to the Left (cont.) • Enter the area to the left of t and df in the parentheses as: invT(area to the left of t, df). • Enter invT(0.05,11). The answer given by the calculator is t ≈ -1.796. If your calculator doesn’t have invT, you must use the printed tables. This is probably the case with TI-83/Plus. Sorry!
Example 8.11: Finding the Value of t Given the Area to the Left , with Excel Excel: T.INV(area to the left of t, df), same thing. Excel special if you know area in two tails total:=T.INV.2T(area in two tails total, df)
Example 8.12: Finding the Value of t Given the Area in Two Tails Find the value of t for a t-distribution with 7 degrees of freedom such that the area to the left of -t plus the area to the right of t is 0.02, as shown in the picture.
Example 8.12: Finding the Value of t Given the Area in Two Tails (cont.) Solution This is a two-tailed problem because the given area, 0.02, is divided between both sides of the distribution. Therefore, when looking up the t-value in the table, we simply find the given area in the row labeled “Area in Two Tails” as shown in the following excerpt from the table. So the value of t for a t-distribution with 7 degrees of freedom such that the total area in the two tails is 0.02 is t = 2.998.
Example 8.12: Finding the Value of t Given the Area in Two Tails (cont.)
Example 8.12: Finding the Value of t Given the Area in Two Tails (cont.) To use a TI-84 Plus calculator to find t given the area in two tails, you need to enter the area in the left tail only. Since the problem indicates that the area is divided between both ends, we must divide the area in half before we use the calculator. Therefore, we calculate the area in one tail as follows: TI-84 invT(area to left, df) does one-tailed only. You make the adjustment when doing a two-tailed problem.
Example 8.12: Finding the Value of t Given the Area in Two Tails (cont.) • Press and then to go to the DISTR menu. • Choose option 4:invT(. • Enter invT(0.01,7). Notice that the value of t that is returned is negative, If you want the positive value of t, just ignore the negative sign since the t-distribution is symmetric.
Example 8.12: Finding the Value of t Given the Area in Two Tails (cont.) – with Excel Recall: we seek t and –t such that two tails total area 0.02, d.f. = 7 Excel with convenient =T.INV.2T(total area, d.f.) Or Excel with one-tailed version, manually divide area by 2: = T.INV(one tailed area, d.f.)
Example 8.13: Finding the Value of t Given Area between -t and t Find the critical value of t for a t-distribution with 29 degrees of freedom such that the area between −t and t is 99%.
Example 8.13: Finding the Value of t Given Area between -t and t (cont.) Solution Since 99% of the area under the curve is in the middle, that leaves 1%, or 0.01 of the area in the two tails. Since the t-distribution has 29 degrees of freedom, look across the row for df = 29 and down the column for an area in two tails of 0.010. Thus, t = 2.756.
Example 8.13: Finding the Value of t Given Area between -t and t (cont.)
Example 8.13: Finding the Value of t Given Area between -t and t (cont.) To use a TI-84 Plus calculator to find t, you need to enter the area in the left tail only. We have determined that the area in two tails is 0.01. Thus, we calculate the area in one tail as follows:
Example 8.13: Finding the Value of t Given Area between -t and t (cont.) • Press and then to go to the DISTR menu. • Choose option 4:invT(. • Enter invT(0.005,29). Notice that the value of t that is returned is negative, If you want the positive value of t, just ignore the negative sign since the t-distribution is symmetric.
Example 8.14: Finding the Critical t-Value for a Confidence Interval Find the critical t-value for a 95% confidence interval using a t-distribution with 24 degrees of freedom. Solution Convert 95% confidence Interval into α = area in two tails and extra adjustment of dividing by 2 if using invT(
Example 8.14: Finding the Critical t-Value for a Confidence Interval (cont.) Since we are looking for the critical value for a 95% confidence interval, we want to find the value of t such that the area between is 0.95. If the area under the curve between the two t-values is c = 0.95, then = 1 − c = 1 − 0.95 = 0.05 is the area in the two tails. Since the t-distribution has 24 degrees of freedom and the area in two tails is 0.05, looking across the row for df = 24 and down the column for an area in two tails of 0.050, we find a critical t-value of
Example 8.14: Finding the Critical t-Value for a Confidence Interval (cont.)
Example 8.14: Finding the Critical t-Value for a Confidence Interval (cont.) To use a TI-84 Plus calculator to find t, you need to enter the area in the left tail only. We have determined that the area in two tails is 0.05. Thus, we calculate the area in one tail as follows:
Example 8.14: Finding the Critical t-Value for a Confidence Interval (cont.) • Press and then to go to the DISTR menu. • Choose option 4:invT(. • Enter invT(0.025,24). Notice that the value of t that is returned is negative, If you want the positive value of t, just ignore the negative sign since the t-distribution is symmetric.