Download
1 / 31
310 likes | 399 Views
Topic: Moisture in the Atmosphere. Water enters the Atmosphere by. A) ---. Mainly from Ocean 70% Earth ’ s surface. Factors Effecting Evaporation Rate. a) Surface Temperature Increases ---. b) Surface Area Increases ---. Evaporation. Evaporation. Puddle A. Puddle B.

E N D
Water enters the Atmosphere by A) --- Mainly from Ocean 70% Earth’s surface
Factors Effecting Evaporation Rate a) Surface Temperature Increases ---
b) Surface Area Increases --- Evaporation Evaporation Puddle A Puddle B
c) Humidity increases --- Air is filled with water, no more evaporation. Evaporation Lake
d) Wind Speed Increases -> --- Lake
B) --- Evaporation and Transpiration = Evapotranspiration
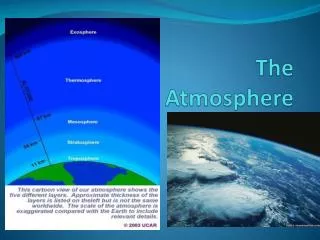
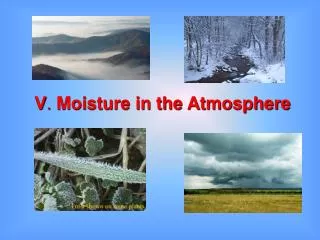
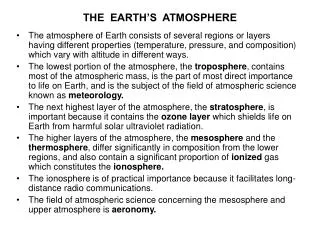
Water is found in all phases in the atmosphere • Solid – Clouds, snow • Liquid – Clouds, rain • Gas - Water vapor
Humidity • ---
Relative Humidity • --- • ---
Dew Point • ---
Condensation What happens when the air temperature and dew point are the same?
Sublimation / Deposition FROST SNOW
Tools used to find Dew Point & Relative Humidity • --- • ---
Dew Point & Relative Humidity Charts Best Friend - pg 12
The “Dry Bulb” = Air Temp • Don’t let it fool you. It is just a thermometer. 20°C
The “Wet Bulb” • Has a little wet booty tied to the bottom. • Gets cool when water evaporates. 12°C Wet Booty
14°C 20°C 12°C 8°C A Dry Day… • A lot of moisture will evaporate. • The wet bulb will be a lot cooler than the dry bulb. 20°C Difference between wet bulb & dry bulb is 12 °C.
A Humid Day… • A little bit of moisture will evaporate. • The wet bulb will not be much cooler than the dry bulb. 20°C 14°C Difference between wet bulb & dry bulb is 6 °C.
20°C 14°C 20-14=6
18°C 16°C 18-16=2
Put it all together 20°C 8°C 20-8=12 Relative Humidity = 11%
14°C 10°C 14-10=4 Relative Humidity = 60%
The Dew Point Chart works the same way 14°C 10°C 14-10=4 Dew Point = 6°C
Try These. % °C % °C % °C
% °C % °C °C % °C °C