Download
1 / 25
250 likes | 402 Views
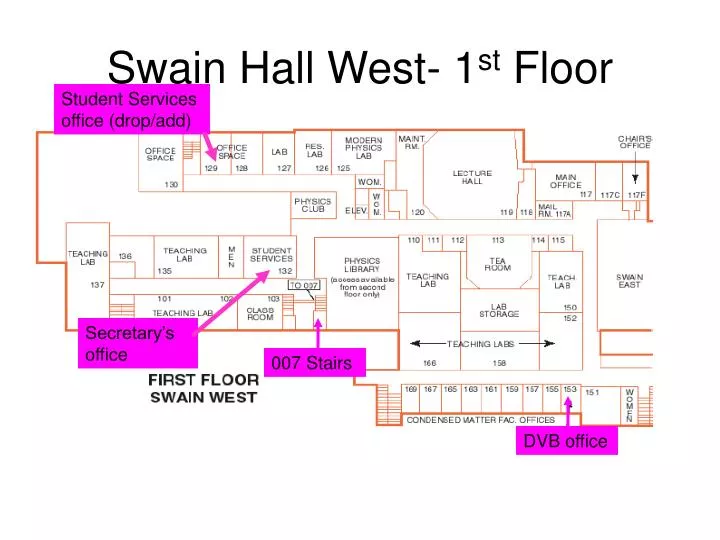
Swain Hall West- 1 st Floor. Student Services office (drop/add). Secretary’s office. 007 Stairs. DVB office. Swain Hall West- 2 nd Floor. Physics Forum. Library. 2006. http://www.purdue.edu/energysummit/index.shtml. Some useful Websites for this Course.

E N D
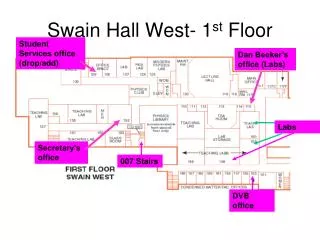
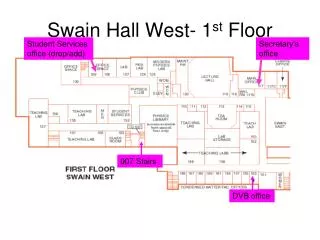
Swain Hall West- 1st Floor Student Services office (drop/add) Secretary’s office 007 Stairs DVB office
Swain Hall West- 2nd Floor Physics Forum Library
2006 http://www.purdue.edu/energysummit/index.shtml
Some useful Websites for this Course • http://www.eia.doe.gov/ (US DOE Energy Information Administration) • http://www.iea.org/index.asp (International Energy Agency) • http://www.epa.gov/ (U.S. Environmental Protection Agency). • http://www.eere.energy.gov/ (U.S. DOE Energy Efficiency and renewable energy). • https://www.cia.gov/library/publications/the-world-factbook/index.html (CIA world fact book)
U.S. Energy Flow, 2005 (Quads) http://www.eia.doe.gov/overview_hd.html • 85% of primary energy is from fossil fuels; 8% is from nuclear; 6% is from renewables. • Most imported energy is petroleum, which is used for transportation. • The end-use sectors (residential, commercial, industrial, transportation) all use comparable amounts of energy. 5
Adding numbers requires the right UNITS!! This sign makes no sense, you can’t add years and people!
Energy appetites for each sector http://www.eia.doe.gov/emeu/aer/pecss_diagram.html
U.S Renewable energy sector (2005) http://www.eia.doe.gov/fuelrenewable.html
Energy Source Distribution NOTE the difference In the nature of the mix!
U.S. Wind power since 1995 DATA FIT 18% annual growth From EIA website Annual Energy Report: 2005
H&K fig. 1.3 Industrialized nations predicted to have 1%/yr growth, developing nations 3%/yr
September ’06 Sci. American One potential source of articles for the article summary and/or term paper
Exponential Growth/Decay Time rate of change of X is PROPORTIONAL to X itself “ y Proportional to x” => y=rx (r is a constant) For our case here: dX/dt=rX (if you like calculus) Solution to this is: X=Xoert ln(X) = ln(Xo) + rt
Exponential Growth/Decay Time rate of change of X is PROPORTIONAL to X itself “ y Proportional to x” => y=rx (r is a constant) For our case here: dX/dt=rX (if you like calculus) Solution to this is: X=Xoert ln(X) = ln(Xo) + rt
A subtle point “Annual compounding” is not the same thing as “continuous compounding”, so you have to be a little careful with how you discuss annual growth rates. True exponential growth with a rate of 7.5%/yr for two years gives an increase of: X=Xoe0.075/yr*2yr =1.162*Xo An “annually compounded” interest rate of 7.5%/yr gives: X=Xo*(1.075)2 =1.156*Xo i.e. e0.075 is not exactly equal to 1.075 (it’s really 1.07788, so it is slightly bigger). The difference between the two cases is greater if you consider greater periods of time.
Hubbert Curve World Coal Production Curve H&K fig. 1.11
Hubbert Curve World Coal Production Curve Exponential extrapolation Data H&K fig. 1.11
Hubbert Curve World Coal Production Curve Exponential extrapolation Data Finite resource -> Final answer is 0 H&K fig. 1.11 Exponential growth CANNOT be sustained in a World of FINITE resources!!
Hubbert Curves US Natural Gas production US Oil production H&K fig. 1.13 H&K fig. 1.12
Note that total temperature change across several ice ages was only about 12oC or about 22oF. CO2 Concentrations and Temperature Change
Energy Conversions (Table 2.2) digestion thermal Incandescent light