Download
1 / 5
80 likes | 872 Views
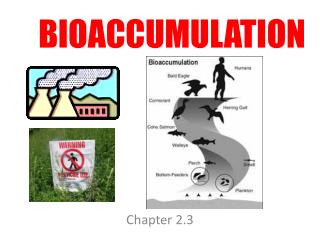
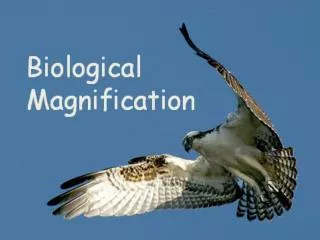
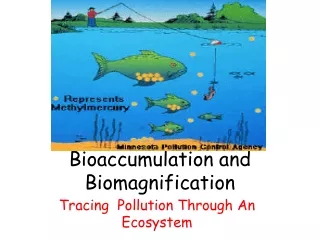
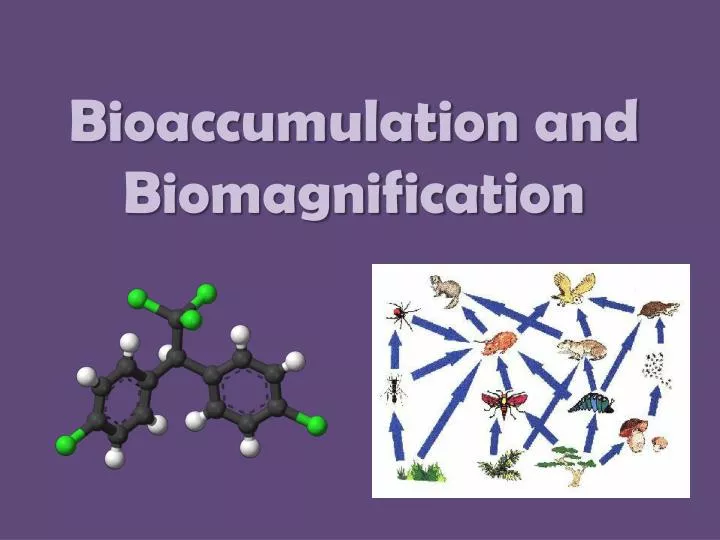
Bioaccumulation and Biomagnification. Bioaccumulation and Biomagnification. Bioaccumulation - how pollutants enter a food chain Biomagnification - pollutants tend to concentrate as they move from one trophic level to the next. Lab Analysis! .

E N D
Bioaccumulation and Biomagnification • Bioaccumulation- how pollutants enter a food chain • Biomagnification- pollutants tend to concentrate as they move from one trophic level to the next.
Lab Analysis! • Each phytoplankton has 200 kcal of energy. We started with 100 phytoplankton. What is the total amount of energy available at the first trophic level??? • 20,000 kcal!
Lab Analysis! • Draw a pyramid of energy for this food chain. Remember the phytoplankton started out with 20,000 kcal of energy! Don’t forget the 10% rule. • Now draw a pyramid showing the amount of DDT present at each level. (hint- this may not look like a normal pyramid) • Describe the differences between the two pyramids. • Compare the amount of DDT found in the osprey with the amount of DDT found in one phytoplankton. Be specific, discuss numerical evidence. • Explain what you have learned through this lab (hint- refer back to our goal on the board)