Download
1 / 1
10 likes | 85 Views
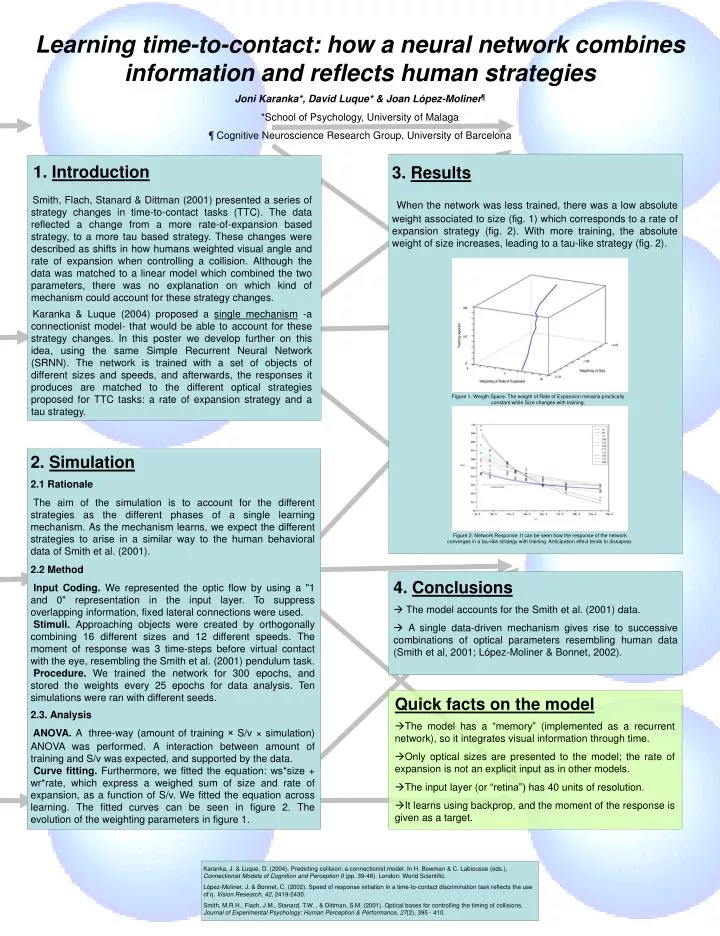
Learning time-to-contact: how a neural network combines information and reflects human strategies Joni Karanka*, David Luque* & Joan López-Moliner ¶ *School of Psychology, University of Malaga ¶ Cognitive Neuroscience Research Group, University of Barcelona. Introduction

E N D
Learning time-to-contact: how a neural network combines information and reflects human strategies Joni Karanka*, David Luque* & Joan López-Moliner¶ *School of Psychology, University of Malaga ¶ Cognitive Neuroscience Research Group, University of Barcelona • Introduction • Smith, Flach, Stanard & Dittman (2001) presented a series of strategy changes in time-to-contact tasks (TTC). The data reflected a change from a more rate-of-expansion based strategy, to a more tau based strategy. These changes were described as shifts in how humans weighted visual angle and rate of expansion when controlling a collision. Although the data was matched to a linear model which combined the two parameters, there was no explanation on which kind of mechanism could account for these strategy changes. • Karanka & Luque (2004) proposed a single mechanism -a connectionist model- that would be able to account for these strategy changes. In this poster we develop further on this idea, using the same Simple Recurrent Neural Network (SRNN). The network is trained with a set of objects of different sizes and speeds, and afterwards, the responses it produces are matched to the different optical strategies proposed for TTC tasks: a rate of expansion strategy and a tau strategy. 3. Results When the network was less trained, there was a low absolute weight associated to size (fig. 1) which corresponds to a rate of expansion strategy (fig. 2). With more training, the absolute weight of size increases, leading to a tau-like strategy (fig. 2). Figure 1. Weigth Space. The weigth of Rate of Expansion remains practically constant while Size changes with training. 2. Simulation 2.1 Rationale The aim of the simulation is to account for the different strategies as the different phases of a single learning mechanism. As the mechanism learns, we expect the different strategies to arise in a similar way to the human behavioral data of Smith et al. (2001). 2.2 Method Input Coding. We represented the optic flow by using a "1 and 0" representation in the input layer. To suppress overlapping information, fixed lateral connections were used. Stimuli. Approaching objects were created by orthogonally combining 16 different sizes and 12 different speeds. The moment of response was 3 time-steps before virtual contact with the eye, resembling the Smith et al. (2001) pendulum task. Procedure. We trained the network for 300 epochs, and stored the weights every 25 epochs for data analysis. Ten simulations were ran with different seeds. 2.3. Analysis ANOVA. Athree-way (amount of training × S/v × simulation) ANOVA was performed. A interaction between amount of training and S/v was expected, and supported by the data. Curve fitting. Furthermore, we fitted the equation: ws*size + wr*rate, which express a weighed sum of size and rate of expansion, as a function of S/v. We fitted the equation across learning. The fitted curves can be seen in figure 2. The evolution of the weighting parameters in figure 1. Figure 2. Network Response. It can be seen how the response of the network converges in a tau-like strategy with training. Anticipation effect tends to dissapear. 4. Conclusions The model accounts for the Smith et al. (2001) data. A single data-driven mechanism gives rise to successive combinations of optical parameters resembling human data (Smith et al, 2001; López-Moliner & Bonnet, 2002). • Quick facts on the model • The model has a “memory” (implemented as a recurrent network), so it integrates visual information through time. • Only optical sizes are presented to the model; the rate of expansion is not an explicit input as in other models. • The input layer (or “retina”) has 40 units of resolution. • It learns using backprop, and the moment of the response is given as a target. Karanka, J. & Luque, D. (2004). Predicting collision: a connectionist model. In H. Bowman & C. Labiousse (eds.), Connectionist Models of Cognition and Perception II (pp. 39-48). London: World Scientific. López-Moliner, J. & Bonnet, C. (2002). Speed of response initiation in a time-to-contact discrimination task reflects the use of η. Vision Research, 42, 2419-2430. Smith, M.R.H., Flach, J.M., Stanard, T.W. , & Dittman, S.M. (2001). Optical bases for controlling the timing of collisions. Journal of Experimental Psychology: Human Perception & Performance, 27(2), 395 - 410.