Download
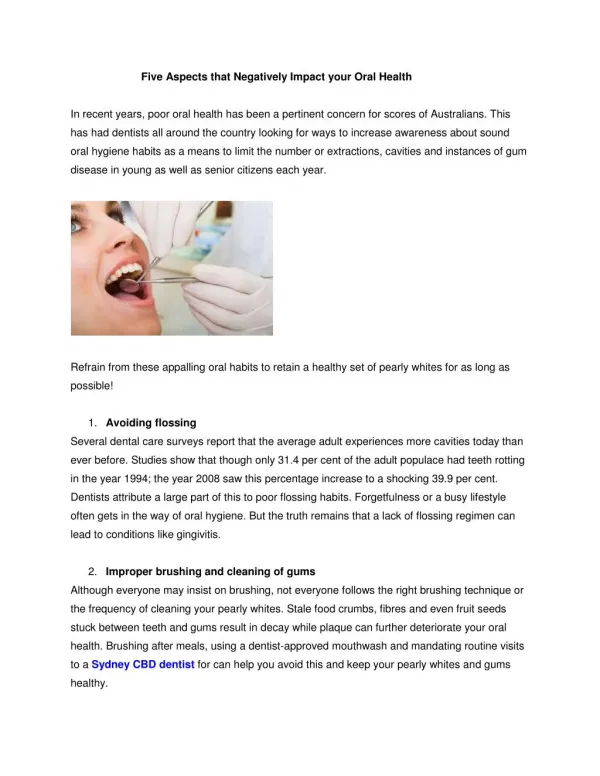
1 / 30
300 likes | 317 Views
Oral Health Training & Calibration Programme. Epidemiology-Calibration. WHO Collaborating Centre for Oral Health Services Research. Oral Health Clinical Survey. Oral Health Clinical Examination Tool. D entate Status Prosthetic Status and Prosthetic Treatment Needs Mucosal Status

E N D
Oral Health Training & Calibration Programme Epidemiology-Calibration WHO Collaborating Centre for Oral Health Services Research
Oral Health Clinical Survey Oral Health Clinical Examination Tool Dentate Status Prosthetic Status and Prosthetic Treatment Needs Mucosal Status Occlusal Status Orthodontic Treatment Status Fluorosis Dean’s Index Gingival Index Debris and Calculus Indices Attachment Loss and Probing Score Tooth Status Chart Count of Tooth Surfaces with Amalgam Trauma Index Treatment and Urgent Needs
Training for: Dentate Status Prosthetic Status Mucosal Status Fluorosis Orthodontic Status Orthodontic Treatment Status Periodontal Assessments Tooth Status Amalgam Count Traumatic Injury Treatment Needs Calibration for: Fluorosis Occulsal Status Periodontal Assessments Tooth Status Amalgam Count Training and Calibration Magnification is not allowed forexaminations
Calibration Objectives Define Epidemiology - Index Discuss Validity and Reliability Examiner Comparability Statistics Calibration Inter and Intra Examiner
Epidemiology • The study of the distribution and determinants of health related states or events in specified populations and the application of this study to the control of health problems. • ‘Epi demos logos’ Greek: • ‘science upon the people’
Measurement of Oral Disease • We use indices: • as a numerical expression to give a group’s relative position on a graded scale with a defined upper and lower limit. • as a standardised method of measurement that allows comparisons to be drawn with others measured with the same index. • to define the stage of disease; not absolute presence or absence.
Desirable characteristics of an index • Valid • Reliable • Acceptable • Easy to use • Amenable to statistical analysis
Prevalence is the number of cases in a defined population at a particular point in time describes a group at a certain point in time similar to a snapshot in time is expressed as a rate -x per 1000 population
Descriptive study Simple description of the health status of a population or community. No effort to link exposures and effects. For example: % with caries % with periodontal disease
Uses of a Prevalence Study • Planning • Targeting • Monitoring • Comparing International Regional
Validity and Reliability Valid Yes Reliable Yes Valid No Reliable No Unbiased Valid No Reliable Yes Valid No Reliable No Biased
Validity • Success in measuring what you set out to measure • Being trained by a Gold Standard trainer ensures validity by Training on what is proposed to be measured Confirming that everyone is measuring the same thing -“singing out of the same hymn book”
Reliability • The extent to which the clinical examination yields the same result on repeated inspection. • Inter-examiner reliability: reproducibility between examiners • Intra-examiner reliability: reproducibility within examiners
Reliability • Calibration ensures inter and intra examiner reliability and allows: International comparisons Regional comparisons Temporal comparisons • Without calibration Are any differences real or due to examiner variability?
Examiner Reliability Statistics • Used when: • Training and calibrating examiners in a new index against a Gold Standard Examiner • Re-calibrating examiners against a Gold Standard Examiner
Examiner Reliability Statistics • Two measures used: Percentage Agreement Kappa Statistic
Percentage Agreement • Percentage agreement is one method to measure Examiner Reliability. • It means: the percentage of judgements where the two examiners have agreed compared to the total number of judgements made
Example – Percentage Agreement Percentage Agreement is equal to the sum of the diagonal values divided by the overall total and multiplied by 100.
Example – Percentage Agreement • Number of agreements = sum of diagonals • = 61 • Total number of cases = overall total • = 100 • Percentage agreement = 61%
Kappa Statistic • The Kappa Statistic measures the agreement between the evaluations of two examiners when both are rating the same objects. • It describes agreement achieved beyond chance, as a proportion of that agreement which is possible beyond chance.
Kappa Statistic • Interpreting Kappa • The value of the Kappa Statistic ranges from 0 - 1.00, with larger values indicating better reliability. A value of 1 indicates perfect agreement. A value of 0 indicates that agreement is no better than chance. • Generally, a Kappa > 0.60 is considered satisfactory.
Interpreting Kappa • 0.00 Agreement is no better than chance • 0.01-0.20 Slight agreement • 0.21-0.40 Fair agreement • 0.41-0.60 Moderate agreement • 0.61-0.80 Substantial agreement • 0.81-0.99 Almost perfect agreement • 1.00 Perfect agreement
Kappa Statistic • The formula for calculating the Kappa Statistic is:
Example – Kappa Statistic PO is the sum of the diagonals divided by the overall total.
Example - Kappa Statistic PE is the sum of each row total multiplied by the corresponding column total divided by square of the overall total
Example - Kappa Statistic • Number of agreements = sum of diagonals = 61 • Total number of cases = overall total = 100 • PO = 0.61
References • Cohen J. A coefficient for nominal scales. Educational and Psychological Measurement 1960; 20: 37-46. • Cohen J. Weighted kappa: nominal scale agreement with provision for scaled disagreement or partial credit. Psychological Bulletin 1968; 70: 213-220.