Download
1 / 36
360 likes | 379 Views
Moscow, 2018. Environmental challenges and opportunities for cities. Felipe Calderón. PORTUGAL. 2017. 520, 000 Ha BURNT. HEATWAVE AND FIRES CENTRAL RUSSIA. 2010. FLOODS SOUTHEAST ASIA 2017. 1/3 OF BANGLADESH UNDER WATER. FLOODS, PARIS 2018. PARIS RECEIVED ITS HEAVIEST RAINS IN

E N D
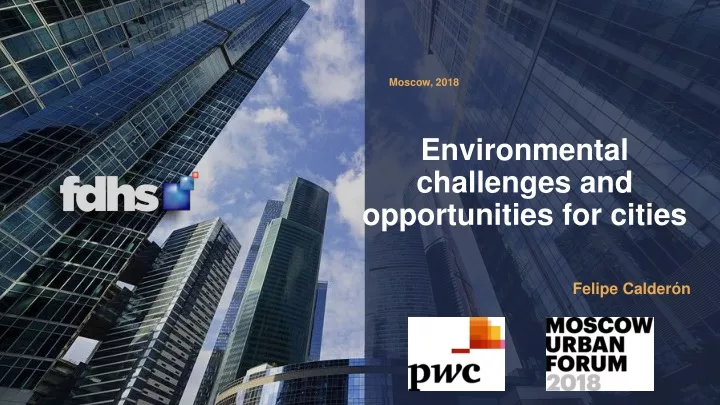
Moscow, 2018 Environmental challenges and opportunities for cities Felipe Calderón
PORTUGAL 2017 520, 000 Ha BURNT
HEATWAVE AND FIRES CENTRAL RUSSIA 2010
FLOODS SOUTHEAST ASIA 2017 1/3 OF BANGLADESH UNDER WATER
FLOODS, PARIS 2018 PARIS RECEIVED ITS HEAVIEST RAINS IN 50 YEARS
HURRICANES KATIA, IRMA AND JOSÉ, CARIBBEAN 2017 90% of buildings in Barbuda destroyed
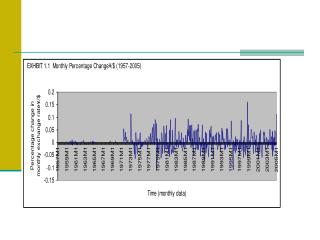
390 HUMANACTIVITIESAREASSOCIATEDWITH CLIMATECHANGE CO2 370 Ppm CO2 °C Temperature 350 14.5 330 14.3 310 290 14.1 270 13.9 250 13.7 13.5 1100 1200 1300 1400 1500 1600 1700 1800 1900 2000 Year Source: Met Office Hadley Center HadCRUT4.
Average Global Temperature of Land and Sea Surface combined, 1850-2012 CHANGE IN GLOBALTEMPERATURE Average Global Temperature per decade 0.4 0.2 0.0 -0.2 -0.4 Temperature (°C) relative to 1961–1990 2014 HOTTEST YEAR ON RECORD, UNTIL 2015 AND NOW 2016 -0.6 1850 1900 1950 2000 Year Source: IPCC, 2013: Summary for Policymakers. In: Climate Change 2013: The Physical Science Basis. Contribution of Working Group I to the Fifth Assessment Report of the Intergovernmental Panel on Climate Change
Air pollution: • 3 million deaths per year • 1 out of 4 megacities faces water stress. • Health expenditure: • 21 billion USD per year • The “urban heat island” effect: 11% of cities´ GDP by 2100. WHAT IS THE IMPACTOF GHG AND CLIMATE CHANGE ONCITIES? Source: 1) WHO, 2014; 2) Munich RE, 2014; 3) WHO; 4) WRI.
THUNDERSTORM IN MOSCOW 2017 13 DEAD 148 INJURED WINDS OF 22 METERS/SECOND
FIGHTING CLIMATE CHANGE PROMOTING ECONOMIC GROWTH It is possible to have better growth and a better climate at the same time IS THERE A DILEMMA? VS.
LAND USE 3 KEY SYSTEMS OBJECTIVE Higher quality, more resilient, inclusive ECONOMIC GROWTH
RETURN ON INVESTMENT OF 12% • OR MORE • 350 TONS • OF CO2/ HECTARE • CAPTURED TEAK PLANTATIONS
ENERGY LAND USE 3 KEY SYSTEMS AND DRIVERS OBJECTIVE Higher quality, more resilient, inclusive ECONOMIC GROWTH
Auction prices (USD) Solar power costs over time USD/MWh Solar PV Current range for fossil fuels (indicative) April 2016 (México) 38 May 2016 (Dubai) 3.0 August 2016 (Chile) 29 • September 2016 (Abu Dabi) 24 November 2017 (Chile) 21.5 SOLAR ENERGY IS NOW 90% CHEAPER THAN IN 2008 Source: Citi Research 2012; Bloomberg NEF (Turner 2013); IEA World Energy Outlook 2013, WEO 2012; Citi Research 2012; G. F Nemet, “Beyond the learning curve”, Energy Policy 34, 3218-3232 (2006)
RETURN OF INVESTMENT: 4 YEARS • Electricity bill: 95% lower DOMESTICRENEWABLEENERGY SYSTEMS ARE A REALITY
CITIES LAND USE 3 KEY SYSTEMS OBJECTIVE Higher quality, more resilient, inclusive ECONOMIC GROWTH ENERGY
≈ 80% of global GDP CITIES ARE AN ENGINE OF ECONOMIC GROWTH ≈ 70% of energy GHG emissions
URBAN POPULATION WILL GROW BY ≈1 BN 2030 1 MOSCOW 1 ST PETERSBURG Every 2 months Every 15 days
ATLANTA BARCELONA Built up area Built up area DIFFERENT MODELS OF URBAN DEVELOPMENT Population 5 million Urban area 648 km2 CO2 emissions from transport 0.7 tons of CO2 per person (public + private transport) Population: 5.26 million Urban area 7,692 km2 CO2 emissions from transport 7.5 tons of CO2 per person (public+ private transport) Source: Bertaud and Richardson, 2004, Kenworthy (2003) citado en Lefevre, B. (2009)
THE CHOICE IS OURS: CLEAN ORPOLLUTING INFRASTRUCTURE
CHEONGGYECHEONGRIVER Urban Policies thinking in people more than in cars FOCUS ON PUBLIC TRANSPORT TURNING ELEVATED HIGHWAYS INTO PARKS SEOUL’SURBAN TRANSFORMATION A VISION BY 2030 1. Source: Cervero and Kang 2009
Business Opportunities: Low carbon transport, buildings and waste management can generate 17 trillion USD globally by 2050 More compact cities: 3 trillion USD in savings by 2030 LOW-CARBON CITIESAND THE NEW CLIMATE ECONOMY
Globally, buildings and construction are responsible for 60% of electricity use LOW-EMISSIONCITIES: RETROFITTINGBUILDINGS • Retrofits in the US • $279 billion investment opportunity • 3.3 million new jobs (direct and indirect) • Gains in Price and Rents in real states Green Buildings in Singapore: 400 million USD in savings by 2030
Trip-planning apps with real-time data of traffic Data on how citizens move across the city THE CONTRIBUTION OF DIGITAL & IT INNOVATION PUBLIC TRANSPORT
Cities will be key to implementing the Paris Agreement 279 mayors in the USA have committed to uphold the Paris goals
CITIES MUST BE BUILT IN A SUSTAINABLE WAY: COMPACT, COORDINATED AND CONNECTED PUBLIC TRANSPORT IS KEY IN BUILDING EFFICIENT CITIES CITIES CAN TAKE CLIMATE ACTION AND LEAD IT THE FUTURE OF THE CITIES IS THE FUTURE OF HUMAN BEING
Temperature forecasted by 2100 Global emissions (Gt per year) 4.5°C BAU scenario OUR GOAL FOR THE 3.5°C NDCs FUTURE: 2ºC 2.0°C Goal Source: Climate Interactive; MIT; IEA.
HEATWAVE AND FIRES 2010 CENTRAL RUSSIA
Small and medium cities will shape the emissions of the future Public transportation is key to shape the growth of the city Incentives for urban sprawl must be eliminated Invest in training and capacity building for urban planning CLIMATEACTION IN SMALL AND MEDIUM SIZED CITIES
BRITISH COLUMBIA GDP +8% Emissions -4% (2008-2009) SWEDEN GDP +58% Emissions -23% (1990-2013) ONTARIO GDP +50% Emissions -6% (1990-2012) DECOUPLING IS A REALITY: IN 2014, 2015 AND 2016 DENMARK GDP +38% Emissions -25% (1990-2012) CALIFORNIA GDP +24% Emissions -20% (2000-2013) EUROPEAN UNION GDP +45% Emissions -19% (1990-2012) US RGGI GDP +9.2% Emissions -18% (2009-2013)