Download
1 / 68
680 likes | 936 Views
ENVR E-115 Sustainable Development. Introduction to the Economics of Sustainability November 13, 2007. How much does gasoline cost?. Introduction to Shadow Pricing?. National Geographic, June, 2004, p. 97. Natural, man-made, and human capital Definitions of sustainability

E N D
ENVR E-115Sustainable Development Introduction to the Economics of Sustainability November 13, 2007
How much does gasoline cost? Introduction to Shadow Pricing?
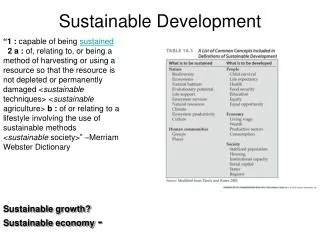
Natural, man-made, and human capital Definitions of sustainability Problem of defining objectives Practical sustainability criteria Place economic values on environmental costs and benefits (User Pays and Polluter Pays Principles) Avoid damage to critical natural capital as far as possible (the Precautionary Principle) Avoid irreversible processes Limit the use of natural assets to their sustainable yield, otherwise include the costs of replacing these assets (Cost of Remediation) Economics of Sustainability
Evolution of economic thinking about sustainability Adam Smith, Ricardo, Marx, Keynes Concepts of welfare Utility maximization Pareto optimality Macroeconomic concepts Production approach to to GDP Microeconomic concepts Demand, supply, and price Public goods Public goods Common property Private goods Issues covered (Chap. 9)
Externalities Externalities and market failure Valuation Total economic value Economic assessment of sustainable projects Assessment of climate change mitigation Issues covered (Chap. 10)
Evolution of Economic Thinking- and the role of different factors -
…an organization of production and consumption such that all unambiguous possibilities for increasing economic well-being have been exhausted. …an allocation of resources such that no further reallocation is possible which would provide gains in production or consumer satisfaction to some firms or individuals without simultaneously imposing losses on others (Pareto optimality) …Pareto optimality can be expressed simply on attainment of; economic efficiency in production of goods and services; economic efficiency in distribution of goods and services; and resource allocation consistent with consumer preferences. Economic Efficiency
Individual preferences count, the economic welfare of a society is based upon the welfare of individual citizens The individual is the best judge of his/her own well-being A change that makes everybody better off with no one being worse off constitutes a positive change in welfare. To get to modern Benefit/Cost practice from Pareto need the “compensation test.” In other words, if the gainers could compensate the losers and still be better off, the change is judged an improvement. This leads to “potential Pareto” improvement. Pareto Rests on Several Value Judgments
Sustainable Social Net Product based on Hick’s definition of income (i.e. maximum value that a person can consume in a period of time and still expect to be as well off at the end of the period as he was at the beginning = Net National Product minus Defensive Expenditures minus the Depression of Natural Capital SSNNP = NNP – DE – DNC “Cost-of-Repair” approach emphasizes measuring the “Defensive Expenditures” part of this index. SOURCE: Daly, 1990 Sustainable Social Net Product
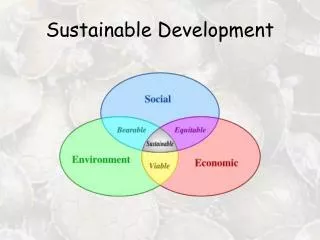
WEAK Combined value of all assets remain constant, or increasing, means that substitution of one form of capital (natural) by another (manufactured) is possible. STRONG Natural capital is a complement to manufactured capital rather than a substitute. This means that natural capital (eg, fisheries or forests) can only be exploited at their natural rate of growth. Sustainability can be Weak or Strong
Item 1930 1940 1950 1960 1970 1980 1990 1995 1999 20001 Gross domestic product $91.3 $101.3 $294.3 $527.4 $1,039.7 $2,795.6 $5,803.2 $7,400.5 $9,268.6 $ 9,872.9 Personal consumption expenditures 70.2 71.2 192.7 332.2 648.9 1,762.9 3,831.5 4,969.0 6,250.2 6,728.4 Gross private domestic investment 10.8 13.6 54.1 75.7 150.4 484.2 847.2 1,110.7 1,636.7 1,767.5 Exports of goods and services 4.4 4.8 12.3 25.3 57.0 278.9 557.2 818.6 989.8 1,102.9 Imports of goods and services 4.1 3.4 11.6 22.8 55.8 293.8 628.6 902.8 1,240.6 1,466.9 Government 10.0 15.1 46.9 113.8 237.1 569.7 1,181.4 1,372.0 1,632.5 1,741.0 Gross Domestic Product or Expenditure, 1930–2000 (in billions of current dollars) (GDP=GNP-net factor earnings from ROW, NNP=GNP-consumption of fixed capital)
Public Good: non-excludable, non-rival consumption. (Lighthouse, flood control) Common Property: non-excludable, rival consumption. (Fisheries, polluting streams) Private Goods: excludable, and rival consumption. (Irrigation, domestic water supply. Public, Common Property, and Private Goods
Externalities Spatial Temporal Valuation Qualitative Quantitative Two Fundamental Issues in Environmental Economics and Policymaking
When is an external effect an Externality? You are driving a car when the person next to you lights up a cigarette. Is this an externality or not? It is, because you were never asked. If the person asks permission to smoke, and you give permission? It is not, because you indicate that you are willing to accept the damages. If he asks and you tell him it will cost him $1? It is not, because if he does not smoke you are not affected, and if he does you have set the price for compensation. In both of the latter two cases you are part of the decision-making process and the externalities have been internalized.
How Externalities and Valuation Affect Decision Making(an example from a Mangrove forest)
Public goods (non-excludable; non-rival consumption) Common property resources (non-excludable; rival consumption) Externalities Un-priced assets and missing markets Lack of property rights Transaction costs Irreversibility Ignorance and uncertainty SOURCES OF MARKET FAILURE
Failure to correct market distortions Subsidies to resource users and polluters Inappropriate tax incentives and credits Over-regulation and under-regulation Conflicting regulatory regimes Bureaucratic obstacles and inertia SOURCES OF GOVERNMENT (POLICY) FAILURE
Changes in Production • Crops, fisheries, water • Health • Opportunity cost • Hedonic Approaches • Property value • Land values • Wage differential • Survey Techniques • CVM (Contingent Valuation Method) • Surrogate Markets • Travel Cost Approaches to Valuation
The Hedonic Pricing Method is most often used to estimate economic values for ecosystem or environmental services that directly affect market prices. It is most commonly applied to variations in housing prices that reflect the value of local environmental attributes. For example, it can be used to estimate economic benefits or costs associated with: • environmental quality, including air pollution, water pollution, or noise • environmental amenities, such as aesthetic views or proximity to recreational sites
The basic premise of the hedonic pricing method is that the price of a marketed good is related to its characteristics, or the services it provides. In general, the price of a house is related to the characteristics of the house and property itself, the characteristics of the neighborhood and community, and environmental characteristics. Thus, if non-environmental factors are controlled for, then any remaining differences in price can be attributed to differences in environmental quality. For example, if all characteristics of houses and neighborhoods throughout an area were the same, except for the level of air pollution, then houses with better air quality would cost more. This higher price reflects the value of cleaner air to people who purchase houses in the area.
The Contingent Valuation Method (CVM) is used to estimate economic values for all kinds of ecosystem and environmental services. It can be used to estimate both use and non-use values, and it is the most widely used method for estimating non-use values. It is also the most controversial of the non-market valuation methods. The contingent valuation method involves directly asking people, in a survey, how much they would be willing to pay for specific environmental services. In some cases, people are asked for the amount of compensation they would be willing to accept to give up specific environmental services. It is called “contingent” valuation, because people are asked to state their willingness to pay, contingent on a specific hypothetical scenario and description of the environmental service.
Contingent valuation is one of the only ways to assign dollar values to non-use values of the environment—values that do not involve market purchases and may not involve direct participation. These values are sometimes referred to as “passive use” values. They include everything from the basic life support functions associated with ecosystem health or biodiversity, to the enjoyment of a scenic vista or a wilderness experience, to appreciating the option to fish or bird watch in the future, or the right to bequest those options to your grandchildren. It also includes the value people place on simply knowing that giant pandas or whales exist.
One of the first contingent valuation studies (1987) to measure the use and non-use values that citizens have for public trust resources was a survey of California households regarding willingness to pay for increased water flows into Mono Lake. The State of California Water Resources Control Board (WRCB) was faced with a decision about how much water to allocate to Los Angeles from sources flowing into Mono Lake. The reduced water flows to the lake were affecting food supplies for nesting and migratory birds. The cost of providing alternate sources to replace the water going into Mono Lake was $26 million per year. The average willingness to pay per household was estimated from the survey to be $13 per month, or $156 per year. Is the decision to invest in alternate resources justified to save Mono Lake?
Private costs (born by individual) Pain & suffering, private medical expenses, lost income External costs (born by others) Publicly provided or insured medical expenses, sick pay Methods Cost of illness, human capital Willingness to pay for benefit (WTP), willingness to accept compensation for harm (WTA) Valuing Human Health Risk
The Value of a Life Saved Body – for chemicals ≈ $5 – for fluids, DNA & tissues ≈ $45 × 106 – 1,000 gm of bone marrow at $23,000/gm ≈ $23 × 106 Doctors & – $250,000 for non-economic damages, i.e., pain and Insurance Co. suffering Median plaintiff in wrongful death cases – $900,000 Sept. 11, 2001 – $250,000 to $7 × 10⁶ Feb. 2004 – injured 9-year old awarded $47 × 106 against Ford US Air Force – ski gondola causes 20 deaths, awarded $2 × 10⁶ each
The Value of a Life Saved (cont.) US Government – shot down Iranian airliner in 1988, 290 victims, $300,000 for wage earners; $150,000 for non- wage earners Deaths in Iraq – US GI killed, family receives $250,000 DOT – values road improvements at $3 × 10⁶ EPA – $3 × 10⁶ in 1984 for benzene emissions OSHA – $5.3 × 10⁶ for life saved due to grain dust rules SuperFund – $3.2 × 10⁶ per life saved EPA under Bush – reduced from $6.1 to $3.7 × 10⁶
Is NOT a measure of the intrinsic worth of an individual Does NOT measure what an individual would pay to avoid certain death (or accept as compensation for certain death) Depends on (total) baseline risk income and wealth May depend on other characteristics of risk e.g., acute trauma or chronic disease “voluntary” or “involuntary” May depend on social, cultural, economic factors Value per Statistical Life
Capital cost Operation and maintenance costs Variable costs and fixed costs Salvage value CATEGORIES OF COSTS
Construction Cost Index History (1908-2003)HOW ENR BUILDS THE INDEX: 200 hours of common labor at the 20-city average of common labor rates, plus 25 cwt of standard structural steel shapes at the mill price prior to 1996 and the fabricated 20-city price from 1996, plus 1.128 tons of portland cement at the 20-city price, plus 1,088 board-ft of 2 x 4 lumber at the 20-city price
The cash flow diagram is a simple tool to depict the cash flows over time You must have an interest rate on the diagram CASH FLOW DIAGRAMS Salvage value Capital costs O&M costs
FUNDAMENTAL DISCOUNT FACTORS P (present value) F U (future amount) (uniform series amount)