Download
1 / 46
460 likes | 637 Views
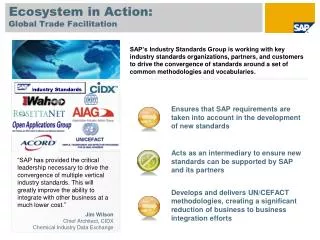
Measuring Trade Facilitation Performance: Introduction & ESCAP Tools. Yann Duval Chief, Trade Facilitation Unit. Table of Contents. Introduction. I. Commonly used cross-country performance measures. II. III. A new measure: ESCAP-World Bank International Trade Cost.

E N D
Measuring Trade Facilitation Performance: Introduction & ESCAP Tools Yann Duval Chief, Trade Facilitation Unit
Table of Contents Introduction I Commonly used cross-country performance measures II III A new measure: ESCAP-World Bank International Trade Cost Business Process Analysis for Trade Facilitation IV Concluding remarks V VI
What is Trade Facilitation (TF)? - Definition • “the simplification and harmonization of international trade procedures” • “measures that aim to increase the cost effectiveness of international trade transactions”
What is Trade Facilitation? –Overview of TF • Significant progress made in reducing time of import/export since 2005, but developed economies also improved during that period • On average, it still takes 30 days to move goods from factory to deck-of-ship at the nearest seaport • South Asia: 30 days • South-East Asia: 20 days • Developed economies: 10 days • Improvements in TF could bring $250 billion in additional trade for Asia and the Pacific
Measuring performance is important From ADB-ESCAP Reference Book on “Designing and Implementing Trade Facilitation in Asia and the Pacific”, available at: http://www.unescap.org/tid/projects/tfforum_adbescapbook.pdf
Existing TF performance measures–Doing Business • Doing Business ranks the business regulation and environment in 185 economies around the world • Ranking is based on 10 topics: starting a business, dealing with construction permits, getting electricity, registering properties, getting credit, protecting investors paying taxes, trading across borders, enforcing contract, resolving insolvency • source: http://www.doingbusiness.org
Existing TF performance measures –Logistic Performance Index • Logistics Performance Index (LPI) indicates the level of logistic friendliness in 155 countries • LPI ranking is based on 6 topics: customs, infrastructure, international shipments, logistics competence, tracking and tracing and timeliness • source: http://lpisurvey.worldbank.org 10
Existing TF performance measures –Logistic Performance Index 11
Existing TF performance measures –LSCI • Liner shipping connectivity Index (LSCI) measures the level of seaport connectivity to the global networks in 159 countries • LSCI ranking is based on 4 topics: numbers of ships, total container-carrying capacity of ships, maximum vessel size, number of services and number of companies that deploys container ships on services to and from a country’s port • source: http://data.worldbank.org/indicator/IS.SHP.GCNW.XQ 12
On measuring trade facilitation performance… Much progress has been made in developing trade facilitation/costs indicators However, there are limitations, including: (reliability of some of the data) Little or no information on bilateral/regional/south-south trade costs Very large variations in trade efficiency across products and trade routes not captured ESCAP is therefore: Developing a database of bilateral and intraregional trade costs [macro] Building capacity in Business Process Analysis of import and export processes [micro]
Table of Contents Introduction I Commonly used cross-country performance measures II III A new measure: ESCAP-World Bank International Trade Cost Business Process Analysis for Trade Facilitation IV Concluding remarks V VI
What is Trade Cost? –Intro/Initiation Direct evidence on border costs shows that tariff barriers are now low in most countries, on average less than 5% for rich countries, on average between 10-20 % for developing countries. Estimated Trade Costs in Industrialized Countries Trade Costs (170%) Transport Costs (21%) Border related trade barriers** (44%) Retail and wholesale distribution costs (55%) Freight costs Transit costs* (9%) Policy barriers (Tariff and NTBs) (8%) Language barrier (7%) Currency barrier (14%) Information costs barrier (6%) Security barrier (3%) *Tax equivalent of the time value of goods in transit. ** The combination of direct observation and inferred costs, which, according to author, is an extremely rough breakdown Source: Anderson and van Wincoop (2004)
ESCAP-WB Trade Cost Database : Definition • Based on the comprehensive trade costs measure proposed by Jacks, Meissner and Novy (2009) • Measure derived from the theory-consistent gravity equation, i.e., ratio based essentially on Bilateral Trade data and Gross Output data • “objective” measure of costs • Captures all additional costs involved in trading goods bilaterally relative to those involved in trading goods domestically. • It includes: • International shipping and logistics costs • Tariff and non-tariff costs, including indirect and direct costs associated with trade procedures and regulations • Costs from differences in language, culture, currencies…
ESCAP-WB Trade Cost Database : Definition • Our measure of ad valorem trade costs: • where • τij denotes geometric average trade costs between country i and country j • tij denotes international trade costs from country i to country j • tji denotes international trade costs from country j to country i • tii denotes intranational trade costs of country i • tjj denotes intranational trade costs of country j • Xij denotes international trade flows from country i to country j • Xji denotes international trade flows from country j to country i • Xii denotes intranational trade of country i • Xjj denotes intranational trade of country j • σ denotes intra-sectoral elasticity of substitution (which is set = 8)
ESCAP-WB Trade Cost Database : Definition • Our measure of ad valorem trade costs: • Intuition: keeping all else constant, a rise in the ratio of international trade relative to domestic trade must be associated with a fall in international trade costs relative to domestic trade costs • Ad valorem ? bilateral trade costs are expressed in % of the value of goods (like tariffs generally are) • Important note: Change in the value of sigma can change the absolute value of trade costs better to look at trade cost relative to each other
ESCAP-WB Trade Cost Database : Definition • Our measure of ad valorem trade costs: • Note that: • Our trade costs are always expressed in terms of international relative to intra-national trade costs • Our trade costs are the geometric average of trade costs in both directions (country i to j and country j to i) • This can makes the identification of policy effects challenging
ESCAP-WB Trade Cost Database : Coverage • 178 countries with at least some coverage • data available from 1995 to 2010/11 • Overall trade cost in goods (excluding oil) • Trade cost in agriculture • Trade cost in manufacturing 21
How to Access Trade Cost Data http://www.unescap.org/tid/artnet/trade-costs.asp 22
How to Access Trade Cost Data http://data.worldbank.org/data-catalog/trade-costs-dataset 23
Trade costs in Developing Countries: Findings – Arvis et al, 2013 • All-inclusive international trade costs are at least one order of magnitude (10 times) larger than tariffs • Our “all-inclusive” measures cover tariffs, NTMs of all types, trade facilitation, connectivity, and logistics, as well as geographical factors, and cultural/historical/institutional factors—everything that drives a wedge between domestic and international prices • Consistent with Anderson and Van Wincoop (2004), who provide a guesstimate of 5% ad valorem for average rich country tariffs, compared with 74% ad valorem for international trade costs 24
Trade costs in Developing Countries: Findings – Arvis et al, 2013 2. Trade costs in developing countries are much higher than in developed countries, and they are falling more slowly 25
Trade costs in Developing Countries: Findings – Arvis et al, 2013 3. Trade costs in agriculture are much higher than trade costs in manufacturing in all income groups, and they are basically static over time 26
Trade costs in Developing Countries: Findings – Arvis et al, 2013 4. Differences in policy and geography/culture translate into different levels of trade costs in different regions 27
Trade costs in Developing Countries: Findings – Asia-Pacific Perspective: TC and NTC NTCij = TCij /(1+tariffij*ji). where tariffij*ji is the geometric average of tariffij and tariffji 28
Trade costs in Developing Countries: Findings – Asia-Pacific Perspective: TC and NTC Agricultural and Manufacturing trade costs* between Selected Economies and the USA 31 *excluding tariff
International Trade Costs (excluding tariffs) of ESCWA region
Explaining trade costs – • From a policy perspective, it is important to break trade costs down into their component parts • Which sources of trade costs are the most important in terms of determining the overall pattern observed across countries? • What sorts of policies would be most effective in lowering trade costs and reducing the relative isolation of many low income countries? • Econometric estimation becomes necessary at this point: we use a model with trade cost variables to explain the observed pattern of trade costs across countries 33
Tariff Trade Costs 0-10%* Direct Behind- & At-the border Trade Costs 1% 60-90%* 6-7% Availability/use of ICT Services 6-7% Business (Regulatory) Environment Policy-Related Non-Tariff Trade Costs Maritime Connectivity/Services 16-18% • Other Trade Costs • Indirect cost of trade procedure • Currency fluctuation • Other non-tariff barriers 52-57% 10-30%* Natural Trade Costs (Geographical and Cultural Factors) Explaining trade costs –Asia-Pacific Perspective Contribution of natural barriers, behind-the border facilitation and trade-related practice to trade costs * Illustrative based on casual observation of the data only. Natural trade costs for landlocked countries may be outside the range shown for natural trade costs. • Improving access to efficient maritime services (liner shipping connectivity) as well as to information and communication technology facilities are essential to making progress. • Given limited resources available, focusing on improving the overall business environment may be often more effective in facilitating trade than implementing soft measures solely targeted at speeding up movement of goods between factory and the port.
Implications from the ESCAP-WB trade cost database • A lot of room for improvement in trade facilitation • Important to take a holistic approach to facilitating trade • - Many components to trade costs • - Availability and quality of logistics infrastructure and services a key component • - Goal is to make the best possible use of existing hard infrastructure • - Use of modern ICT also one of the keys Paperless trade • Sectoral focus of trade facilitation initiatives should be considered (e.g., agriculture) • Micro-level studies need to be conducted • - for specific routes, border crossings, and/or key products • - to form the basis of national/sub-regional TF action plans 35
Table of Contents Introduction I Commonly used cross-country performance measures II III A new measure: ESCAP-World Bank International Trade Cost Business Process Analysis for Trade Facilitation IV Concluding remarks V VI
ESCAP’s Initiative on Business Process Analysis (BPA) for Trade Facilitation BPA? Analysis, including mapping, timing and costing of a process (e.g., moving goods from factory to deck of ship) Why? Necessary first step to improving a process • Part of ESCAP’s support to paperless trade • United Nations Network of Experts for Paperless Trade in Asia and the Pacific (UNNExT) • www.unescap.org/unnext/ • UNNExT Business Process Analysis Guide for the Simplification of Trade Procedures
Output of a UNNExT Business Process Analysis (1) Use Case Diagram Activity Diagrams Define scope of analysis, stakeholders involved, Activities to be studied 38
Output of a UNNExT Business Process Analysis (2)The time-procedure chart* *Frozen shrimp exports; Data collected by Institute for IT Innovation, Kasetsart University (2007)
ARTNeT* Regional BPA Study of Import and Export Processes *Asia-Pacific Research and Training Network on Trade
Trade in Electronics from CHINA to THAILAND Number of parties: 11 on export side; 12 on import side Number of documents: 17 on export side; 44 on import side
Some findings from the BPA studies • Document preparation takes most time, followed by transport/ handling issues • “Basic” trade facilitation measures not always in place • Procedures between private parties are a very big part of the overall trade process • Different countries require different documents and information for a same export product • Harmonization of procedures and documentary requirements crucial • Importance of port logistics confirmed • … • Large variations in time and cost across products (or product usage), transport routes, destination, firm size,… Note: The ARTNeT study was exploratory in nature. Data collected needs to be carefully validated (e.g., through multi-stakeholder meetings).
Policy Recommendations from BPA (1) • Full and inclusive representation of the private sector in trade facilitation initiatives is essential. • Implementation of basic trade facilitation measures should be consistently enforced and re-enforced nation-wide. • Paperless trade, including development of national and regional single windows, needs to be prioritized for trade facilitation. • Physical inspections should be minimized whenever possible, in particular through adoption of risk management techniques by all organizations involved in the trade process.
Policy Recommendations from BPA (2) • Healthy competition among transport, logistics and other trade-related service providers should be encouraged • Reviewing payment systems and their efficiency may reveal new opportunities for improving trade facilitation performance. • Industry-specific trade facilitation programmes should be considered, in particular for agricultural products. • Harmonization of documentary requirements across countries should beactivelypursued. • Bilateral and regional free trade agreements should systematically addresstrade facilitation issues.
Concluding remark(s) National / regional trade facilitation performance monitoring mechanisms needed to identify the most important barriers to trade efficiency couldbebased on regular business processanalysis of tradeprocedures (supplemented by time release studies)
For more information www.unescap.org\unnext\ Thank You! (duvaly@un.org)