Download

1 / 47
470 likes | 594 Views
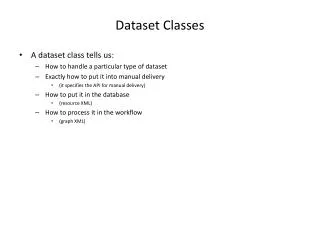
A Novel Framework to Elucidate Core Classes in a Dataset. Daniel Soria d.soria@cs.nott.ac.uk G54DMT - Data Mining Techniques and Applications 22 nd March 2011. Outline. Aims and motivations Framework Clustering and consensus Supervised learning Validation on two clinical data sets

E N D
A Novel Frameworkto Elucidate Core Classes in a Dataset Daniel Soria d.soria@cs.nott.ac.uk G54DMT - Data Mining Techniques and Applications 22nd March 2011
Outline • Aims and motivations • Framework • Clustering and consensus • Supervised learning • Validation on two clinical data sets • Conclusions and questions
Aims and motivations • Develop an original framework with multiple steps to extract most representative classes from any dataset • Refine the phenotypic characterisation of breast cancer • Move the medical decision making process from a single technique approach to a multi-technique one • Guide clinicians in the choice of the favourite andmost powerful treatment to reach a personalised healthcare
Framework (1) no yes
Framework (2) yes no
Data pre-processing • Dealing with missing values • Homogeneous variables • Computedescriptive statistics
Clustering • Four different algorithms: • Hierarchical (HCA) • Fuzzy c-means (FCM) • K-means (KM) • Partitioning Around Medoids (PAM) • Methods run with the number of clusters varying from 2to20
Hierarchical method • Hierarchy of clusters • Represented with a tree (dendrogram) • Clusters obtained cutting the dendrogramat specific height
Hierarchical method (cont.) 6 clusters
FCM method • Minimisationof the o. f. • X = {x1,x2,...,xn}:ndata points • V = {v1,v2,…,vc}:ccluster centres • U=(μij)n*c:fuzzy partition matrix • μij:membership of xito vj • m:fuzziness index
KM method • Minimisationof the o. f. • ||xi-vj||:Euclidean distance betweenxiand vj • cj:data points in clusterj • vj
PAM method • Search for krepresentative objects (medoids) among the observations • Minimum sum of dissimilarities • kclusters are constructed by assigning each observation to the nearest medoid
If n is unknown… • Validity indicescomputation • Defined considering the data dispersion within and between clusters • According to decision rules, the best number of clusters may be selected
Characterisation & agreement • Visualisation techniques • Biplots • Boxplots • Indices for assessing agreement • Cohen’s kappa (κ) • Rand
Definition of classes • Consensus clustering: • Align labels to have similar clusters named in thesame way by different algorithms • Take into account points assigned to groups with the same label
Supervised learning (1) • Model-based classification for prediction of future cases • Aims • High quality prediction • Reduce number of variables (biomarkers) • Prefer ‘white-box’ prediction models
Supervised learning (2) • Different techniques: • C4.5 • Multi-Layer Perceptron Artificial Neural Network (MLP-ANN) • Naïve Bayes (NB) or Non-Parametric Bayesian Classifier (NPBC)
C4.5 classifier • Each attribute can be used to make a decision that splits the data into smaller subsets • Information gainthat results from choosing an attribute for splitting the data • Attribute with highest information gain is the one used to make the decision
Multi-Layer Perceptron • Feed-forward ANN • Nonlinear activation function used by each neuron • Layers of hidden nodes connected with every other node in the following layer • Learning carried out through back-propagation
Naïve Bayes classifier • Probabilistic classifier based on Bayes’ theorem • Good for multi-dimensional data • Common assumptions: • Independence of variables • Normality
NPBC: ratiobetweenareas (1) • Similar to Naïve Bayes • Useful for non-normal data • Based on ratio between areasunder the histogram • The closer a data point is to the median, the higher the probability to belong to that specific class 25
NPBC: ratiobetweenareas (2) x< m x > m datapointx median m median m datapointx ER ER Soria et al. (2011): A `Non-Parametric’ Version of the Naïve Bayes Classifier. To appear in Knowledge-Based Systems 26
Characterisation of classes • Biplots • Boxplots • Relation with clinical information • Survival analysis
Validation of the framework (1) • Set of markers involved in breast cancer cell cycle regulation • 347 patients and 4 markers • Survival and grade available • K-means, PAM and Fuzzy C-means used • Validity indices for best number of clusters
Agreement and consensus • Kappa index high for 3 groups classification • 3 common classes found (8.9% not classified) • Intermediateexpression (class 1) • High expression (class 2) • Lowexpression (class 3)
Biplots of classes (1) °: Class 1 °: Class 2 °: Class 3
Biplots of classes (2) °: Class 1 °: Class 2 °: Class 3 °: N.C.
Clinical information • High grade patients (poor prognosis) in classes 1 and 3 (worst survival) • Common classes group patients with similar outcome
Validation of the framework (2) • Patients entered into the NottinghamTenovus Primary Breast Carcinoma Series between 1986 and 1998 • 1076 cases informative for all 25 biological markers • Clinical information(grade, size, age, survival, follow-up, etc.) available
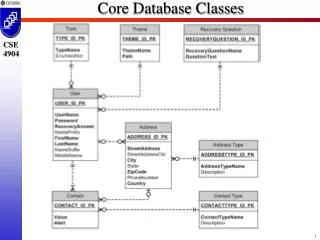
Breast Cancer ER+ Luminal CKs+ ER- Basal CKs- ER- HER2+ Mixed Class (38.4%) • HER2 Class 6 (7.2%) Luminal Basal PgR+ PgR- p53+ p53- • p53 altered Class 4 (7.6%) p53 normal Class 5 (6.4%) HER3+ HER4+ HER3- HER4- HER3+ HER4+ Luminal A Class 1 (18.8%) • Luminal N Class 2 (14.2%) Luminal B Class 3 (7.4%) Consensus Clustering
Conclusions • Original framework for identification of core classes • Formed by different logical steps • Validation over novel data sets • 3 classes (Low, IntermediateandHigh) • High marker levels for better survival • Discover of novel cancer subtypes
Main references • L. Kaufman, P.J. Rousseeuw. Finding groups in data, Wiley series in probability and mathematical statistics, 1990. • A. Weingessel, et al. An Examination Of Indexes For Determining The Number Of Clusters In Binary Data Sets, Working Paper No.29, 1999. • I. H. Witten and E. Frank. DataMining: Practical machine learning tools and techniques. Morgan Kaufmann Publishers, 2005. • A.K. Jain and R.C. Dubes. Algorithms for Clustering Data. Prentice-Hall advanced reference series, Prentice-Hall. Englewood Cliffs, NJ, USA, 1988. • A.K. Jain, M.N. Murty, and P.J. Flynn. Data clustering: A review. ACM Computing Surveys, 31(3):264–323, 1999. • P.F. Velleman and D.C. Hoaglin. Applications, Basics and Computing of Exploratory Data Analysis. Boston, Mass.: Duxbury Press, 1981. • J. Quinlan. C4.5: Programs for Machine Learning. Morgan Kaufmann, Los Altos, California, 1993. • S. Haykin. Neural Networks: A Comprehensive Foundation. Prentice Hall, 2 edition, 1998. • G. John and P. Langley. Estimating continuous distributions in bayesian classifiers. Proceeding of the Eleventh Conference on Uncertainty in Artificial Intelligence, 1995.
Acknowledgements Dr JM Garibaldi, Dr J Bacardit Nottingham Breast Cancer Pathology RG Prof IO Ellis, Dr AR Green, Dr D Powe, Prof G Ball 46
Thank You! • Contact: d.soria@cs.nott.ac.uk