Download
1 / 24
240 likes | 367 Views
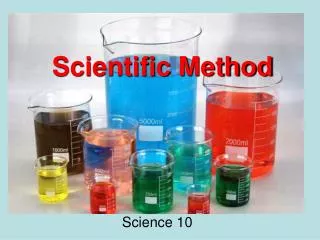
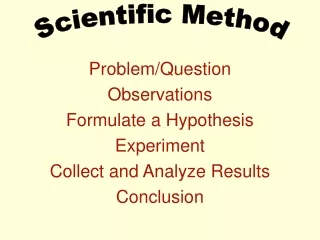
Scientific Method. S. Dickinson Biology 2011-2012. In your notes, write about what you think of this picture. Think-pair-share. Get with a neighbor and share what you wrote in your notes Share with the class. What do you think the first part of the Scientific Method is?.

E N D
Scientific Method S. Dickinson Biology 2011-2012
Think-pair-share Get with a neighbor and share what you wrote in your notes Share with the class
What do you think the first part of the Scientific Method is?
What do you think the question was in this experiment? What will you use for comparison?
Scientific Method • Certain methods to obtain knowledge • Ask questions… and then what? • 7 Steps • Have you ever asked who, what, where, when, how, or why? That’s the beginning.
What was the question? Formulate a hypothesis. Write it in your notes. What is changed on purpose?
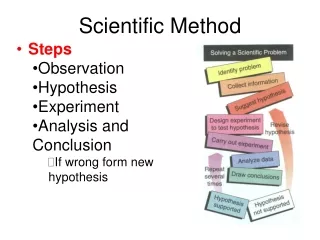
Steps in the Scientific Method • Use observations to identify a problem • Formulate a hypothesis • Construct a procedure (step by step directions) • Conduct your experiment • Collect and analyze data • Draw a conclusion • Repeat
Step 1: Use observations to identify a problem Observation • Employs one or more of the 5 senses • Direct or indirect • Can you use your senses directly to study electricity?
Step 2: Formulating a Hypothesis • Testable statement • Evidence does or does not support the statement • IF (put independent variable here), THEN (put dependent variable here) statement • If the virus causes a deadly disease then introducing that virus into healthy tissue will cause the tissue to die. • Rewrite your former hypothesis • Not all hypotheses are in If, then format.
Independent vs. Dependent • Independent is manipulated variable (what you change) - ex. Light exposure, food, time, depth, scent, etc. • Dependent is responding variable (DATA) (what happens due to the change) - ex. Height, growth, amount of oxygen produced, etc. • REMEMBER: D – dependent R – responding Y – axis M – manipulated I – independent X – axis
Step 3: Procedure • Step by step directions that are self explanatory • Number your steps • Be specific about equipment, amounts, units, etc… but not wordy
Step 4: Experimenting • Testing a hypothesis by gathering data under controlled conditions Controlled Experiment • You change onefactor or variable and observe its effect on another while keeping all other factors the same or constant
Experimenting cont… Constant: variables that stay the same through out the experiment ex. Same amount of water in all beakers, same sized beakers, same plants… Control:a sample that is treated like the other experiment groups but the independent variable isn’t applied (what normally takes place) ex. You are testing a new drug. One group received the drug; the other group was a placebo (sugar pill). The group given the placebo is the control group.
Scenarios • As a group, analyze the scenarios to come up with: • What is the question being raised? • Independent Variable? • Dependent Variable? • Control? • Constant(s)? • Write a hypothesis based on the scenario.
How do you collect data on this experiment? Will it be the same for all experiments?
Step 5: Collecting and analyzing data Forms of Data Collection: 1. Measuring • Quantitative data: data is measured in numbers • Number of people in a group • Measurements of a cube • Duration of an event 2. Sampling • Using a small part to represent an entire population • Must be large and random • Should include as many subjects as possible
Forms of Data Collection cont… 3. Organizing Data • Data is useless unless its organized • Data table, graphs, chart, concept map (appendix A)
Analyzing Data • Process of determining whether datayou collected is reliableand if it supports your hypothesis or not • Data can be analyzed in several ways • Statistics to determine a relationship between the variables • Compare the data with those obtained in other trials or studies • Determine sources of error
Analyzing Data cont. • Data analysis shows general or specific trends or patterns from a graph that you have created from your data chart or table. General Trend: From 1955 to 1995, the total amount of ozone decreased from 325 d.u. to 169 d.u. in Antarctica. Specific Trend: From1964 to 1966, the total amount of ozone increased from 280 d.u. to 320 d.u. in Antarctica.
Step 6: Drawing Conclusions • Create a Model • Constructing a representation of an object or process that shows a relationship among the data • Visual, verbal or mathematical • Inferring • Conclusion made on the basis of the facts or data gathered during your experiment • Forming a Theory • May be formed after many related hypothesis have been tested and supported by much experimental data • Broad and comprehensive statement that is thought to be true
Step 7: Repeat! Make sure the data is accurate (you can reproduce it) Precision: how close you are to the actual number
Do you think all steps are used all the time and in the same order? Think-pair-share
Ticket out the door – identify EXD Ellen set up three identical ten-gallon aquariums. The walls and tops were covered with black construction paper to prevent light from entering. Ten feeder guppies were added to each aquarium as test subjects. A small corner of each aquarium was left open, and a small reading light is placed over it. Each day, the light is turned on over the aquarium, and thirty seconds later, a small amount of food is added to two of the aquariums. No food is added to the third aquarium at this time. Every five days for twenty days, the number of fish that come to the light before the food is offered is recorded.