Download

1 / 27
280 likes | 532 Views
Regional Carbon Budgets: from Methodologies to Quantification Beijing, China, 15-18 November 2004. The C budget of Japan: Ecosystem Model (TsuBiMo). Y. YAMAGATA and G. ALEXANDROV Climate Change Research Project, National Institute for Environmental Studies, JAPAN. Outline.

E N D
Regional Carbon Budgets: from Methodologies to Quantification Beijing, China, 15-18 November 2004 The C budget of Japan: Ecosystem Model (TsuBiMo) Y. YAMAGATA and G. ALEXANDROV Climate Change Research Project, National Institute for Environmental Studies, JAPAN
Outline • Structure of model • Calibration of model using flux data • Calibration using inventory data • Estimation of carbon stock, NPP and NEP • Comparison with ecological measurement and inventory based estimate • Accuracy assessment of R/S (FPAR) data use • Conclusion and future direction
Outline • Structure of model • Calibration of model using flux data • Calibration using inventory data • Estimation of carbon stock, NPP and NEP • Comparison with ecological measurement and inventory based estimate • Accuracy assessment of R/S (FPAR) data use • Conclusion and future direction
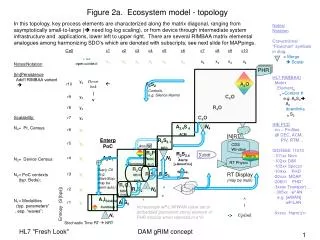
Gross Primary Production Heterotrophic respiration Litterfall Autotrophic respiration Structure of our forest ecosystem carbon balance model (TsuBiMo)
Herbaceous fraction of litter-fall Woody fraction of litter-fall The carbon pools of litter The carbon pools of litter very resistant fraction non-resistant fraction resistant fraction TsuBiMo: Litter-fall compartment
Regional Carbon Budget Assessment using TsuBiMo Changes in total carbon stock of the managed forests in Japan Carbon stock changes in the pool of living organic matter Carbon stock changes in the pool of non- living organic matter GPP (Pg) NPP (Pn) Accumulation in biomass NEP (PE) NBP Satellite images (JAXA) CO2 fluxes (JapanFlux) Yield tables (MAFF) Age distribution (MAFF)
Input data: grids of 1km resolution • Monthly temperature • Monthly precipitation • Monthly solar radiation • Forest age structure • Managed forest 15 age classes of 5-years • Natural forests 4 age classes of 20-years
Outline • Structure of model • Calibration of model using flux data • Calibration using inventory data • Estimation of carbon stock, NPP and NEP • Comparison with ecological measurement and inventory based estimate • Accuracy assessment of R/S (FPAR) data use • Conclusion and future direction
Takayama Flux Cite Pictures From Dr. Nishida 2003/10/17 2003/11/6
Re (night time flux) - NEE (day time flux) GPP Scheme of using CO2 flux data for calibrating productivity model Observation TsuBiMo function for GPP : Pmax light-saturated photosynthesis K light attenuation coefficient ß light-use efficiency fPAR fraction of absorbed PAR
Calibrated Productivity Model (Takayama Flux Data 1999-2001)
CO2 fluxes v.s. Productivity Model BLUE – observed fluxes YELLOW- 28-days moving average RED – model estimates The model could successfully replicate the forest ecosystem CO2 flux responses to climate variations
Agreement with World Biometric Data of Calibrated Productivity Model Blue – Local Calibration Red – Global Calibration
Outline • Structure of model • Calibration of model using flux data • Calibration using inventory data • Estimation of carbon stock, NPP and NEP • Comparison with ecological measurement and inventory based estimate • Accuracy assessment of R/S (FPAR) data use • Conclusion and future direction
Yield Table data for Growth Function TsuBiMo function for biomass growth : Yield table data Age dependence of wood stock in m3/ha (yield tables) The estimates of conversion coefficient specified by age The model parameters depends on species and site fertility, however the data from ecological studies are not sufficient. -> We use yield table data for filling the gap.
Yield Tables v.s. Model Estimates subtropical warm-temperate cool-temperate Sugi, North Kinki (Fukuda et al., 2004) assumed Line shows the values produced by the function above for b2=0.854772; Pnb1=4.61481 Dots show the values derived from the yield table above by using the assumed conversion coefficient
Outline • Structure of model • Calibration of model using flux data • Calibration using inventory data • Estimation of carbon stock, NPP and NEP • Comparison with ecological measurement and inventory based estimate • Accuracy assessment of R/S (FPAR) data use • Conclusion and future direction
Stock, tC/ha Stock classes 0 Very Low 40 Low 80 Average 120 3.75 GtC 160 High 200 Carbon Stock in Japanese Forest Carbon Stock is estimated using TsuBiMo
Legend: Interpretation in terms of vegetation zones NPP, g C/m2/yr 150 Subalpine conifer forest zone 350 Cool-temperate broadleaf forest zone 550 Warm-temperate broadleaf forest zone 700 850 Subtropical forest zone 1350 NPP of Japanese Forests NPP is estimated using TsuBiMo from vegetation period, light intensity, temperature and precipitation
Forest Age and Carbon Stock in Japan Forest age data Carbon stock estimate Area of the k-th age class (sk ) Carbon stock changes with age
NEP estimates in Japanese forest Scenario: harvest age lifted up to 70 years Alexandrov, G.A., Yamagata, Y., 2002. Net Biome Production of managed forests in Japan. Science in China, 45 (Supp): 109-115
Outline • Structure of model • Calibration of model using flux data • Calibration using inventory data • Estimation of carbon stock, NPP and NEP • Comparison with ecological measurement and inventory based estimate • Accuracy assessment of R/S (FPAR) data use • Conclusion and future direction
Model v.s. Carbon Stock Data Beech forest in Japan Black: total carbon stock after breakup Grey: carbon stock changes in the tree biomass Lines: Model estimates (Kawaguchi and Yoda,1986)
Comparison of NEP estimate (tentative) Forestry inventory Ecological model 17.9MtC/yr 21.0MtC/yr Artificial forest only (tC/ha・yr)
Outline • Structure of model • Calibration of model using flux data • Calibration using inventory data • Estimation of carbon stock, NPP and NEP • Comparison with ecological measurement and inventory based estimate • Accuracy assessment of R/S (FPAR) data use • Conclusion and future direction
Accuracy assessment of R/S data use Yellow – MODIS Blue – Ground Productivity can be estimated by using FPAR as input to Model
Conclusion and future direction • We have try to estimate the national level carbon budget using a process based ecosystem model (TsuBiMo) • Calibration with flux and inventory data showed that the global model underestimate the productivity at managed forest test sites • comparisons of national level estimate with inventory approach showed regional discrepancies but rather good total coincidence • Model-data integration using different data sources including R/S need to be developed