Download
1 / 13
130 likes | 314 Views
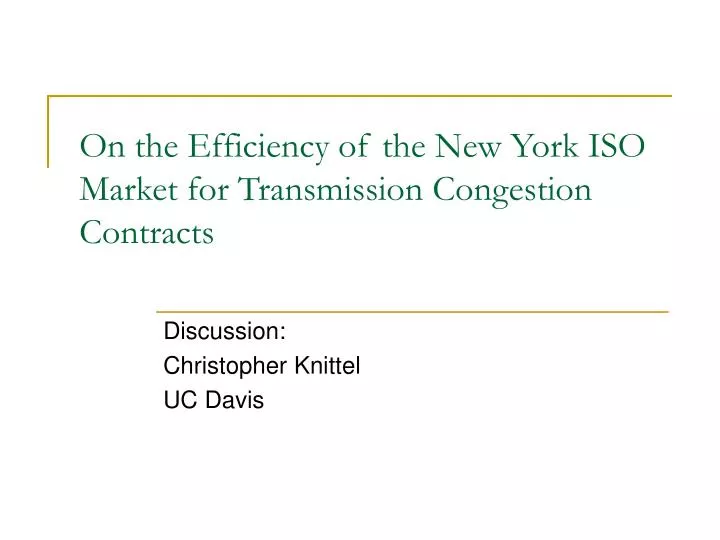
On the Efficiency of the New York ISO Market for Transmission Congestion Contracts. Discussion: Christopher Knittel UC Davis. General Thoughts on Paper. A very nice paper on an important topic Are electricity forward and spot markets operating efficiently (in the finance sense)?

E N D
On the Efficiency of the New York ISO Market for Transmission Congestion Contracts Discussion: Christopher Knittel UC Davis
General Thoughts on Paper • A very nice paper on an important topic • Are electricity forward and spot markets operating efficiently (in the finance sense)? • Two papers on day-ahead and real-time energy markets: • Borenstein, Bushnell, Knittel and Wolfram (shameless plug) • Wang and Longstaff • This is the first to look at transmission rights • Visually oriented paper • 17 Tables and 73 Figures!!!! • Main Comment: Do we have enough data to say anything meaningful?
Research Question • Empirical Methodology • For each auction, they estimate • Efficient market with no risk premium would predict that: α equal zero and β equals 1 • Unaddressed: where does the risk premium go?
Data and Results • The data are from auctions held in 2000 and 2001 • Auctions occurred twice yearly (4 auctions in total) • 4 Rounds per auction (total of 14 rounds) • Two rounds had no bids (?) • The authors look at each round separately and compare the OLS regression to a 45 degree line (α equal zero and β equals 1) • Results suggest that α>0 and β<1 • On average, make money on small bets, but lose money on large bets
Typical Result 45 degree line OLS Equation: α>0 β<1 Actual Congestion Rents TCC Price
Discussion Question #1 • Should the relationship be a 45º line? • Risk neutrality would imply a linear relationship, but why hedge if you are risk neutral? • With risk aversion, the efficient relationship might be non-linear • Figures would suggest that firms willing to pay a greater risk premium for larger hedges • Not unrealistic • For a given class of utility functions, the authors might be able to compute the implied risk aversion parameter
Risk Aversion = Non-linear? 45 degree line Actual Congestion Rents TCC Price
Discussion Question #2 • How many observations do the authors really have? • The authors have data on 4 auctions • Within each auction there are numerous outcomes • But, these outcomes are all based on the same information (e.g., predictions of weather patterns during the same time period). • Therefore, the forecast errors for all of these bids should be highly correlated • In the extreme, the authors have only 4 observations
An Extreme Example • Suppose there are two paths connecting Northern and Southern California • There are two auctions held for the rights to each of these rights • After the auction, it is revealed to be much hotter in the north than expected • The prices paid in both auctions will end up being less than the actual rents accrued • But, treating both of these auctions as evidence of an inefficiency would be double counting! • “Unique Award” section supports this
Testing for Efficiency • The authors look at the results from each individual auction separately and see if the bids were equal in expectation • The previous example suggests that we should look at multiple auctions over time and see if the prices were equal in expectation • The expectations at any one point in time are almost surely going to be wrong, but on average (i.e. across time), they should be correct • Unfortunately, they only have 4 auctions
Discussion Question #3 • Would we expect efficiency in the first 4 auctions? • This was a new market, with new rules, etc. • It is reasonable to expect some firms will make mistakes early on • Did firms simply bid prices based on historical congestion rents? • This is a Bayesian updating “game” – not likely to get it right in the first auction • And, maybe not even in the fourth auction • Is there evidence of learning?
Discussion Question #4 • Can we ever expect efficiency in electricity markets? • Is arbitraging price differences “gaming the market”? • There is some evidence that policy makers may think so • If a company sees an inefficiency, but is worried it will be sued if it takes advantage of the inefficiency (i.e. arbitrage) then the inefficiency may remain • We need to be clear what is “gaming the system” and what is the “invisible hand”
Conclusions • Nice paper that may need more data to show systematic price differences • Should look at results over time, not for one particular auction • Need to think about how risk aversion changes the analysis