Download
1 / 41
460 likes | 709 Views
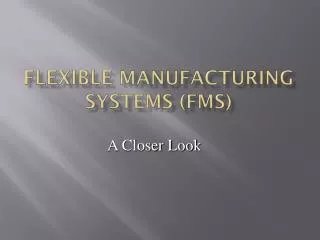
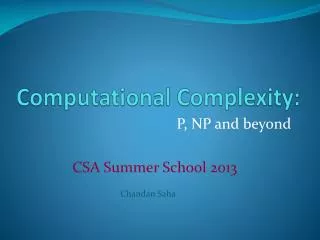
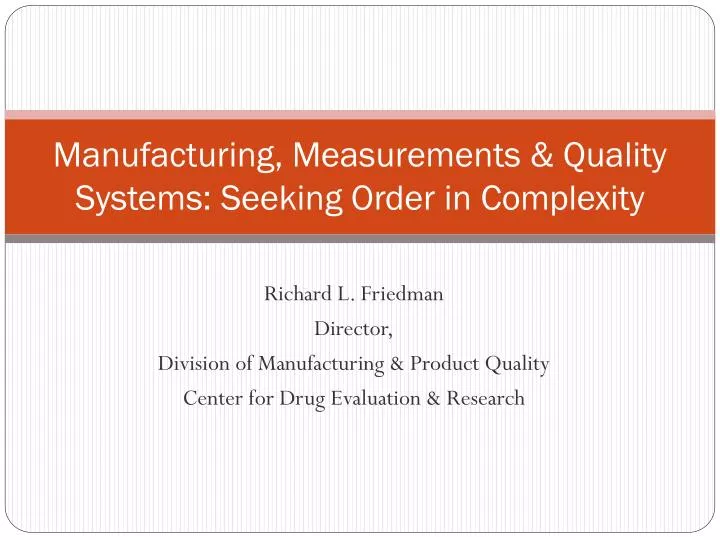
Manufacturing, Measurements & Quality Systems: Seeking Order in Complexity. Richard L. Friedman Director, Division of Manufacturing & Product Quality Center for Drug Evaluation & Research. Initiate. Quality Risk Management Process. Risk Assessment. Risk Identification. Risk Analysis.

E N D
Manufacturing, Measurements & Quality Systems: Seeking Order in Complexity Richard L. Friedman Director, Division of Manufacturing & Product Quality Center for Drug Evaluation & Research
Initiate Quality Risk Management Process Risk Assessment Risk Identification Risk Analysis Risk Evaluation unacceptable Risk Control Risk Reduction Risk Acceptance Output / Result of the Quality Risk Management Process Risk Review Review Events ICH Q9Risk Control Risk Communication Risk Management Tools
Pharmaceutical Manufacturing “Conventional pharmaceutical manufacturing is generally accomplished using batch processing with laboratory testing conducted on collected samples to evaluate quality.” “…significant opportunities exist for improving development, manufacturing, and quality assurance through innovation in product and process development, process analysis, and process control.” Guidance for Industry: PAT – A Framework for Innovative Pharamceutical Development, Manufacturing, and Quality Assurance (2004)
Includes: Materials System Equipment & Facilities Production Laboratory Packaging & Labeling Quality System The Quality System: Foundation for Assuring an Ongoing State of Control
Adaptation: Process Control and Improvement FEEDBACK SYSTEMS: “Control procedures shall be establishedto monitor the output and to validate the performance of those manufacturing processes that may be responsible for causing variabilityin the characteristics ofin-process material and the drug product” (211.110a) IMPROVEMENT: Firm must review, at least annually, the quality standards of each drug product to determine the need for changes in drug product specifications or manufacturing or control procedures. (211.180)
Goal of a Manufacturing Organization • Provide a consistent, defect-free product to the marketplace via consistent manufacturing operations • Assure safety & efficacy …But not every company has established adequate quality practices, or achieved predictable output. Some companies, products, or processes make more mistakes /defective units than others. Why?
“Putting out fires is not improvement of the process” - W. Edward Deming
Each production day, each dose, each patient If you are operating at 3.8 Sigma, you are getting it right 99 percent of the time... It turns out that even a 1 percent error can add up to a lot of mistakes pretty fast. Getting it right 99 percent of the time is the equivalent of 20,000 lost articles of mail every hour. It’s 5,000 botched surgical procedures every week. It’s four accidents per day at major airports... If you can answer when, where and howoften the defects occur you have what you need... But don’t just focus on the symptoms of the problem. Find the root causes. Chowdury, 2001
Current state of Pharmaceutical Manufacturing The Gold Sheet, January 2009
“The basis of all scientific work is the conviction that the world is an ordered and comprehensible entity” – Einstein
For a Measurement to provide meaningful evaluation of quality, it should: • Provide a direct measure of the critical in vitro attribute that is the surrogate for the in vivo clinical attribute (ideally with IVIVC) • Provide very high assurance that process reproducibly meets its limits & specifications for each batch • Have a purpose (why measure?) • to detect and prevent non-conforming in-process and finished product output – i.e., assure effective control of the process • …and thus greatly reduce risk of any defective product reaching the consumer • Be sufficient and timely (how, where, when & how often?) • Be reliable. Measurement capability (good analysis provides the truth; allows for correct decisions)
How, where, when and how often to measure? Tests • Qualitative vs. quantitative • Instrument and operator interfaces • to process • to sample • Timeliness and frequency • Method of sampling • destructive or non-destructive • at-line (sample removed), offline (sample temporarily diverted off-stream) or in-line (on-stream from a distance) • invasion of process stream can affect measurement • representative of the batch or providing worst case assessment • periodic, continuous, stratified to risk
Sources of Variability When developing or evaluating a process, essential questions include: • What variables in the process are influential, and require careful control and intensified monitoring? • Why and how can a particular variable affect final product quality? • How should cGMP procedures be designed to control that variable? Each significant variable can be measured in one or more ways. As variables are measured, a reliable picture of batch quality will emerge.
Quality System Detection of Variation & Defects before Distribution • Test of a firm’s Quality System is if it will promptly catch a problem in a batch vs. discovering only after it is marketed. • Mistakes are, in many cases, not caught by the individual making the error, but instead through final inspection or QC test! • QC testing is of limited sample size intended to assess a chemical, microbiological, or physical attribute. • To avoid detecting mistakes or defects only after a drug product has been distributed: • Use Redundancy of Controls, or PAT
Product Quality: How good is batch-to-batch QC testing? • Specifications alone can not assure product quality. • Quality must be built in (21 CFR §§ 211.100, 211.110) • QC testing regimens may be found during lifecycle to be insufficient. Enhanced process control or new/modified QC tests might be needed. • Passing result for finished product potency, dissolution or content uniformity, on its own, does not provide high assurance that it will pass again. • Sample sizes are not always sufficient, and processes are not always stable.
Potential for Dissolution Variability • If a given lot just barely passes the USP or approved criteria once, what is the probability of passing 2 to 8 more times? • Depending on the overall inherent lot variability, it can range from 0.3% to 100%
Case Study #1 Dissolution Failure (multivariate cause?) • It was concluded that the cause of the dissolution failure was a combination of factors, including a formulation change, specifically a 1% increase in lubricant, a subtle change in the effective density of the tablets, the bulk density of microcrystalline cellulose and the process which changed mixing principle (v-blender vs. shaker mixer). • Dissolution testing on stability ultimately detectedthe problem. • 3 batches failed (but only 1 batch/year typically placed on stability by firms)
Case Study #2 Subpotency (multivariate cause?) • Tablet product • Assay failure on Stability (9 months) • Firm’s investigation concludes that product stability needs to be improved by: • changing to a different API source • modification of formula • improved container/closure system
Microbiological Measurements: Complexity of Measuring Risk to the Patient • Type of organism • “Opportunistic not primary pathogens cause most infection” • Infective dose • Very elusive based on next factor… • Host resistance/susceptibility to infection • Route of Administration • “In general, the risk of infection will be much reduced for a drug given orally or applied to intact skin compared with a formulation used for treatment of abraded skin or mucous membrane, or damaged eye.” [Bloomfield, “Microbial Contamination: Spoilage and Hazard.” Chapter 2 in Guide to Microbiological Control in Pharmaceuticals, 1990.]
OOS Guidance FDA’s 2006 Guidance addresses:1. Conducting/concluding the investigation2. Interpretation of results3. Handling of inconclusive results4. Retesting5. Appropriate use of averaging6. Appropriate use of outlier tests
OOS Guidance: General Recommended procedures for OOS investigations are divided into two phases to reflect that the OOS result can be caused by either: • An aberration of the measurement process (i.e. laboratory error) • An aberration of the production process (i.e. the product is OOS)
OOS Guidance: General • Too often root cause is unknown, or arbitrarily attributed to an analyst. Two possibilities: • Product related variability: Formulation components, manufacturing process, operator, etc. • Measurement system (method) related variability: Sampling bias, apparatus setup, analytical, operator, reference standard, etc.
Warning Letter – Data IntegrityCan You Trust the Reported Measurements? • Failure to establish appropriate controls over computer or related systems to assure that changes in master production and control records or other records are instituted only by authorized personnel (21 CFR § 211.68 (b)). The UV/Visible spectrophotometer data acquisition systems allow analysts to modify, overwrite, and delete original raw data files. • This equipment is used for dissolution testing of finished product, stability samples, and process and method validation studies. • All laboratory personnel were given roles as Managers, which allowed them to modify, delete, and overwrite results files. • This system also does not include an audit trail or any history of revisions that would record any modification or deletion of raw data or files. • Your laboratory computer system lacks necessary controls to ensure that data is protected from tampering, and it also lacks audit trail capabilities to detect data that could be potentially compromised. [Paraphrased]
OOS Guidance -Investigations OOS results may indicate a flaw in product or process design. For example, a lack of robustness in product formulation, inadequate raw material characterization or control, substantial variation introduced by one or more unit operations of the manufacturing process, or a combination of these factors can be the cause of inconsistent product quality. In such cases, it is essential that redesign of the product or process be undertaken to ensure reproducible product quality.
Building knowledge…Opportunities for Variability Reduction and Innovation [ICH Q10 ] “Implement appropriate product quality improvements, process improvements, variability reduction, innovations and pharmaceutical quality system enhancements.
NIR in PAT • Provides NIR spectral signature (reflectance from solid or transmission through liquid) with adequate signal/noise ratio • spectra contain information on chemical composition as well as physical attributes of particulates • Process Endpoints: information can be used to monitor progress of a chemical or physical change, and determine unit process endpoints • API synthesis, drier moisture endpoint, blending, solvent evaporation, online content uniformity and tablet weights, etc. • Increasingly used for real time release
Steps in Pharmaceutical Process Development & Scale-up Validation of Predictions Learning Predictions using models Experimentation and Data Analysis
Building knowledge…Development “Monitoring during scale-up activities can provide a preliminary indication of process performance and the successful integration into manufacturing. Knowledge obtained during transfer and scale-up activities can be useful in further developing the control strategy.” [ICH Q10 – Technology Transfer] Monitoring during Monitoring during scale-up activities scale-up activities can provide a can provide a preliminary preliminary indication of process indication of process performance and the performance and the successful integration successful integration into manufacturing. into manufacturing. Knowledge obtained Knowledge obtained during transfer and during transfer and scale up activities scale up activities can be useful in can be useful in further developing further developing the control strategy the control strategy
From Development to Commercial Scale Process Development predictions can be affected by: • Lack of fundamental knowledge and understanding of scaledependent factors • Lack of correspondence between equipment used in lab and in factory • Lack of full understanding of critical attributes of raw materials, and how they affect physics and mechanics of processing • Finite time lines and pressures to market curtail some process development and scale-up activities
Predictions - DOE Weaknesses Based on model Predictions are extrapolations inside as well as outside explored space Experiments done at lab scale Missed factors Missed interactions at screening Each factor alone has little impact e.g., cycle # and regeneration buffer salt Greater weakness for complex products and processes Dr. S. Kozlowski, 2008
Pilot Scale and Lot Data Multivariate SPA • Statistical Process Analysis • Gap between process experience and DOE Adapted from T. Kourti
Building Knowledge…Monitoring and Adaptation Process performance and product quality monitoring systems for each product should include: Management review of process performance and product quality Corrective action & preventive action (CAPA) and Change Management Continuous Process Verification (CPV ) provides strong scientific basis for maintaining “state of control” throughout commercial lifecycle. Pre-approval Post-approval Product Lifecycle 37
“Constantly and forever improve the system of production and service” • - W. Edward Deming
CGMP: Every batch, Every day… “We rely upon the manufacturing controls and standards to ensure that time and time again, lot after lot, year after year the same clinical profile will be delivered because the product will be the same in its quality… We have to think of the primary customers as people consuming that medicine and we have to think of the statute and what we are guaranteeing in there, that the drug will continue to be safe and effective and performas described in the label.” - Janet Woodcock, M.D.
Summary: Paradigm Shift • Quality Should Be: • Proactive, rather than reactive • Built on knowledge and understanding of product, process and materials • Built in through design of facilities, equipment and processes (CGMP) • Based on use of state of the art tools of measurement science to control processes • Utility of Better Measurements in Quality Assurance • Improved process control • Continuous quality monitoring in real time • Automated, objective decision algorithms • Data can be analyzed retrospectively (performance monitoring) to trigger improvements in process capability
Acknowledgments: Tara Gooen Vibhakar Shah Lynn Torbeck Steve Wolfgang For More Information: www.fda.gov/aboutfda/centersoffices/cder/ucm096102.ht