Download
1 / 11
110 likes | 184 Views

E N D
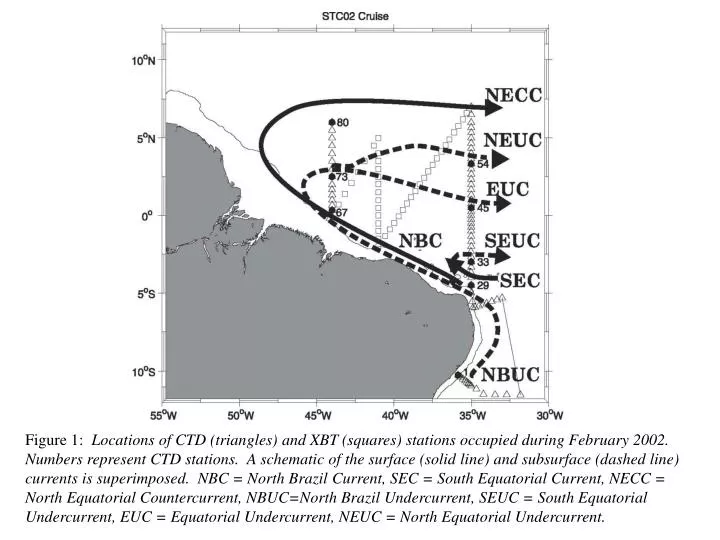
Figure 1: Locations of CTD (triangles) and XBT (squares) stations occupied during February 2002. Numbers represent CTD stations. A schematic of the surface (solid line) and subsurface (dashed line) currents is superimposed. NBC = North Brazil Current, SEC = South Equatorial Current, NECC = North Equatorial Countercurrent, NBUC=North Brazil Undercurrent, SEUC = South Equatorial Undercurrent, EUC = Equatorial Undercurrent, NEUC = North Equatorial Undercurrent.
Figure 2: Normalized root mean square errors associated with the fields gridded by objective analysis.
Figure 3: Temperature salinity (upper panel), temperature oxygen (middle panel) and oxygen salinity (lower panel) curves representative of SAW (South Atlantic Water), EAW (Eastern Atlantic Water) and NAW (North Atlantic Water).
Figure 4: Vertical sections of the northward (eastward) component of speed (m/s) for the 11°S (upper left), 5°S (upper right), 35°W (middle left), 41°W (middle right) and 44°W (center bottom) transects shown on Figure 1. The 24.5 and 26.8 isopycnal surfaces and transport of the major currents are also given. NBC = North Brazil Current, SEC = South Equatorial Current, NECC = North Equatorial Countercurrent, NBUC=North Brazil Undercurrent, SEUC = South Equatorial Undercurrent, EUC = Equatorial Undercurrent, NEUC = North Equatorial Undercurrent. Station positions are indicated at the top of each panel.
Figure 5: Oxygen salinity curves for the layer extending from the sea surface to the 24.5 isopycnal from stations along 44°W. The curve from station 70 is representative of stations 65 to 69, all in the NBC (Fig. 4). Station numbers are given close to the deepest point of the layer.
Figure 6: Oxygen salinity curves for the layer bounded by the 24.5 and 26.8 isopycnals from stations along 11°S. Stations 1, 2, 3 and 6 are in the NBUC and stations 9, 16, and 18 in the offshore southward flow (Fig. 4). Station numbers are given close to the deepest point of the layer.
Figure 7: Oxygen salinity curves for the layer bounded by the 24.5 and 26.8 isopycnals from stations along 35°W. Station 30 is in the NBC, stations 31 to 34 in the SEUC and station 36 in the recirculation gyre to the north of the SEUC (Fig. 4). Station numbers are given close to the deepest point of the layer.
Figure 8: Oxygen salinity curves for the layer bounded by the 24.5 and 26.8 isopycnals from casts along 44°W: the curve from station 68 (in the NBC) is representative of the curves from stations 65 to 67, also in the NBC. Stations 69 to 75 are in the core of eastward flow at 44°W (Fig. 4). Station numbers are givenclose to the deepest point of the layer.
Figure 9: Oxygen salinity curves for the layer bounded by the 24.5 and 26.8 isopycnals from casts along 44°W (station 68 in the NBC and 72 in the eastward core, Fig. 4) and 35°W (station 38 in the recirculation gyre and 41, 43, 46, and 49 in the EUC, Fig. 4). Station numbers are given the closeto the deepest point of the layer.
Figure 10: Oxygen salinity curves for the layer bounded by the 24.5 and 26.8 isopycnals from casts along 44°W (stations 74,75, in the eastward core, Fig. 4) and 35°W (stations 53, 54, and 55, in the NEUC, Fig. 4).
Figure 11: Upper panels: Stream function fields for the upper, right panel (lower, left panel) layer bounded by the surface and 24.5 (24.5 and 26.8) isopycnal surfaces. Lower panels: Potential vorticity fieldsfor the same layers.