Download
1 / 26
260 likes | 370 Views
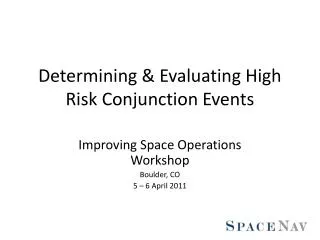
UNCLASSIFIED. Determining Risk from Fragmentation Events. Roger C. Thompson The Aerospace corporation. Systems Engineering Division The Aerospace Corporation 5 April 2011. UNCLASSIFIED. UNCLASSIFIED. Outline. Background – s pace d ebris and risk m odeling Debris environment

E N D
UNCLASSIFIED Determining Risk from Fragmentation Events Roger C. ThompsonThe Aerospace corporation Systems Engineering Division The Aerospace Corporation 5 April 2011 UNCLASSIFIED
UNCLASSIFIED Outline • Background – space debris and risk modeling • Debris environment • The Aerospace Corporation’s experience in space debris and risk modeling • Launch collision avoidance • Debris Analysis Response Team (DART) • The Aerospace Corporation’s research and development • Methodologies • Software UNCLASSIFIED
Space debris has been growing operational concern for years ISS Conjunctions, Mar 09 Iridium 33 / Cosmos 2251 collision, Feb 09 USA 193, Feb 08 Chinese ASAT test, Jan 07 On-orbit collisions (e.g. US rocket body / Chinese launch debris, Jan 05) Multiple recent breakup events (e.g. SL-12, Mar 09, Briz-M, Feb 07) Launch vehicle debris shedding (e.g. Delta IV / DMSP-17, Nov 06) Aerospace models risk FROM Cataloged objects Background environment Debris-producing events UNCLASSIFIED Space Debris and Collision Risk Modeling Aerospace models risk TO • New launches (LCOLA) • Resident, active spacecraft (DART) • Specific close approach scenarios as requested UNCLASSIFIED
UNCLASSIFIED Space Debris Analysis Resident Space Object Catalog Other space environment Other intelligence • Characterize Debris Event: • Identify objects • Generate modeled debris • Determine breakup time and location • Background models • Determine Risk, • Create Products: • LCOLA • DART products • COLA • Anomaly resolution • Ops support • Debris Producing Event: • Collisions • ASATs • On-orbit breakups • Launch shedding Tracking Data:Aerospace Fusion Center AFRL, NROC, JSPOC, ESA, NASA, AFSPC, SSN Figure is UNCLASSIFIED UNCLASSIFIED
UNCLASSIFIED Debris Environment • Space debris comes from multiple sources • Background debris (naturally occurring or manmade – too small to track) • Cataloged debris (launch and deployment related – trackable) • Debris producing events (explosions, collisions) • Debris producing events generate a moderate number of large debris particles which will get cataloged and a huge number of smaller debris particles which will never be tracked or cataloged • Smaller particles will eventually dissipate and become part of a slightly enhanced background • Prior to dissipation, they pose an unseen, elevated risk to resident spacecraft Table is UNCLASSIFIED UNCLASSIFIED
UNCLASSIFIED Background Models • All active spacecraft implicitly accept risk from “background” of small, untrackable objects: micrometeoroids, man-made debris • Two major background models • NASA ORDEM 2000 • ESA MASTER 05 • Neither model includes recent major breakup events • ORDEM update being evaluated • Aerospace applies both models to provide risk points of reference Average risk/day in LEO = 3x10⁻⁶ Figure is UNCLASSIFIED UNCLASSIFIED
UNCLASSIFIED LCOLA Support Overview • Aerospace provides Launch Collision Avoidance (LCOLA) analyses for NRO, SMC, and NASA (Goddard Spaceflight Center) launches • Support specifically required by Mission Directors for all NRO &SMC missions • NASA support coordinated through OSL • Support to both rehearsals and launch • Software development began in 1996 • Probability of collision would open more launch opportunities • Protection would be consistent with distance-based blackouts • Launch-on-Minute (LOM) or Launch-on-Second (LOS) • Range Safety, Space Safety, and Mission Assurance COLAintegrated into a single simple report UNCLASSIFIED
UNCLASSIFIED DART – Debris Event Quick Response CONOPS NASA External information taskingevents Trajectory reconstruction (Aerospace Fusion Center) Target determination Asset list Debris generation Model database Iterate as new data becomes available Mission Ground Sites Collision risk assessment Asset list Aerospace customer interface Generate reports Government customers Aerospace Process Figure is UNCLASSIFIED UNCLASSIFIED
UNCLASSIFIED Debris Generation • Typical ASAT event will produce over 4 million particles (discrete element sets) • Mass distribution • Cumulative number of fragments of a given mass and larger • Spread velocity distribution • Fragment velocities relative to center of mass of debris cloud • Determines extent of and density variations within debris cloud • Area/mass distribution • Function of constituent material densities Figures are UNCLASSIFIED UNCLASSIFIED
UNCLASSIFIED Collision Risk Assessment Probabilistic Continuum Model of Debris Cloud Path traversed by satellite through debris cloud Satellite with cross-section Expanding debris cloud Cumulative fluence (average no. impacts, summed over layers) Local debris relative encounter velocity Local debris density Collision probability Figure is UNCLASSIFIED UNCLASSIFIED
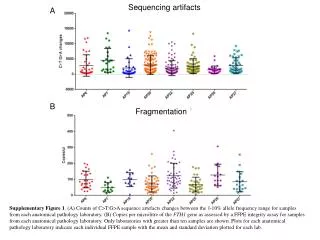
UNCLASSIFIED Decreasing Risk Sample DART ReportIridium collision – Worst case 100% Fragmentation Space Risk for 10-11 Feb Table is UNCLASSIFIED IRIDIUM 33 collision with COSMOS 2251 10 Feb 2009 16:55:59.8 UTC Each scatter dot represents a space asset Graphic is UNCLASSIFIED UNCLASSIFIED
UNCLASSIFIED Risk Analyses • Multiple reports are generated at various stages in timeline • Many reports aim at providing an understanding of risk for individual or groups of spacecraft • Reports vary with circumstances of breakup, issue being explored Figures are UNCLASSIFIED Graphic is UNCLASSIFIED UNCLASSIFIED
UNCLASSIFIED Debris Field Evolution • Many reports, plots, animations address the evolution of the debris field • SOAP displays shown real-time at NROC, JSpOC Debris not to scale Figures are UNCLASSIFIED UNCLASSIFIED
UNCLASSIFIED February 2008 US Intercept January 2007 Chinese ASAT Event Intercept Altitude Particles per 50 km altitude shell Intercept Altitude Chinese vs. US Impact Events The colors represent the density of debris within an altitude band. Higher density means higher probability of encounter for satellites in that band. The density drops as debris is cleaned out by the atmosphere. Time is measured from the impact. Figure is UNCLASSIFIED Figure is UNCLASSIFIED Only 10% of the particles have decayed in 60 days, and only 18% in one year. In 5 years, only 31% have decayed, and 69% are still in orbit. 77% of particles decay in 1 day, 90% in 17 days, and over 99% in 97 days. Less than 0.01% remain in orbit after a year. UNCLASSIFIED
UNCLASSIFIED Comparison to Tracked Debris Iridium Collision + 60 days Cosmos • Tracking, cataloging of debris still underway • 1949 objects cataloged (as of 14 March 2011) • COSMOS debris count is almost 3 times the Iridium count • Models matched reasonably well 2 months after collision • Less than half of the current object count had been cataloged 60 days after event • ~95% of debris is still in orbit Debris not to scale Figure is UNCLASSIFIED UNCLASSIFIED
UNCLASSIFIED Ballistic Missile Intercept Simulations • Characterize risk prior to actual events • Debris is short-lived, event will be over before DART can respond • Analyses focus on the risk from intercept-generated debris to • Resident space objects • People and vehicles on the ground from the reentry of the debris into the atmosphere • Debris risk will be dependent on altitude, latitude, and the geometry of the intercept(s) • Four orbit classes defined to assess risk to RSOs • Sun-synchronous, ~98 inclination • Mid-inclination (45) • Critically-inclined (63) • Communications, ~85 inclination UNCLASSIFIED
UNCLASSIFIED Methodology • For each orbit class • Vary altitudes from 422 - 1122 km (6800 – 7500 km radius) • Eight different altitudes, 100 km increments • Location of satellite in orbit will be important • Debris is short-lived, but density is relatively high • Satellites will be in the wrong place/wrong time or miss the event entirely • Create a Walker constellation for each altitude • 36 planes (every 10 in RAAN) • 36 satellites in each plane (every 10 in Mean Anomaly) • Total of 10,368 satellites in each orbit class • Provides an estimate of wrong place/wrong time risk in addition to collision risk from debris encounters UNCLASSIFIED
UNCLASSIFIED Methodology (cont’d) • Perform Collision Risk Assessment (slide 10) • For each debris particle • Propagate all 10,368 satellites over the life of the debris objects • Use an exaggerated cross-sectional area to obtain a statistically significant number of “hits” • Particle flux is a function of the number of “hits” and the volume swept out by the sphere • Probability is calculated from particle flux • Fraction of satellites encountering any debris divided by total satellites represents risk (%) of being in the wrong place at the wrong time • Probability of collision is the calculated risk if the satellite does encounter debris • Maximum and minimum probabilities reported to characterize the distribution/spread of the debris • Compare to background risk from untracked objects to determine elevated risk UNCLASSIFIED
UNCLASSIFIED Sample Results – Probability of Collision Late Boost Intercept Mid-Course Intercept UNCLASSIFIED
UNCLASSIFIED Sample Results – Relative Risk for 12 Cases Sun-Synchronous Orbits UNCLASSIFIED
UNCLASSIFIED Other Related Activities NAVSTAR 29 disposal orbit evolution • Delta IV debris shedding analyses • Model development from on-board video • Risk assessment for DSP-23, L-49, L-26 • Upper stage and satellite disposal analyses • Minimize collision risk for disposed GPS, HEO, and GEO objects for 100+ yrs • Established the Center for Orbital Reentry and Debris Studies (CORDS) in 1997 Debris cloud risk vs. satellite RAAN L26 debris lifetime vs. shedding time UNCLASSIFIED
UNCLASSIFIED Aerospace Debris and Risk Models Compared with MDA, NASA • MDA, NASA, Aerospace conducted joint study in summer 2007 to compare modeling approaches and results • Motivated by FY-1C event • Each breakup model is based on empirical data from ground- and space-based tests, but not the same tests • Each model has been in use for a number of years for applications specific to the developing organization • Each model uses a different set of input parameters • Approach was to compare individual model results with data measured/collected from two real world events • Highlight areas for potential model improvements • Study yielded good agreement, joint report briefing issued UNCLASSIFIED
UNCLASSIFIED Figure is Unclassified Vulnerability Area = 30m2 Cross Sectional Area Of ISS Aerospace Model STEPAL Model Debris Cloud Risk Model ComparisonAerospace and STEPAL Risk Models • Plot shows impact risk posed to ISS vs. intercept time for a hypothetical intercept scenario, ISS RAAN = 0, initial mean anomaly = 289.014° • Results are based on KIDD breakup model (fragments with mass >= 3 mm Al sphere) Impact Risk Posed to ISS vs. Intercept Time (3mm debris data) UNCLASSIFIED
UNCLASSIFIED Model Comparison Conclusions Overall, the best agreement between model-to-measured data is found when the intercept event matches the events comprising the empirical data upon which the model is based • For a missile intercept case, MDA predictions were the most consistent of the three models with measurement data • For a satellite intercept case, the NASA and Aerospace predictions were more consistent with measurement data (RCS) • NASA/Aerospace showed the best agreement in debris RCS for larger debris • MDA showed the best agreement in debris RCS for smaller debris • Aerospace showed the best agreement with debris tracks • Risk analysis will be scenario dependent UNCLASSIFIED
UNCLASSIFIED DART Experience • 2satellite intercepts (FY-1C and USA-193) and 1 satellite collision (Iridium 33) • 4launch debris cloud risk assessments • 14real world close approaches • 29 exercises • Special analyses where processes applied to answer specific questions • Model comparison with MDA and NASA • NASA: NASA Standard breakup model/SBRAM risk assessment tool • MDA: KIDD breakup model/REBLE risk assessment tool • Bottom line: satellite risk assessments agree within an order of magnitude • Current usage has all been below 1000 km • Includes ballistic missile intercept simulations UNCLASSIFIED
UNCLASSIFIED Summary of Aerospace Debris Analysis Activities • High profile of recent debris event have raised significant concerns about space debris • Govt support to Commercial and Foreign Enterprises (CFE) is of particular concern • Aerospace has active research programs addressing multiple aspects of space debris and space situational awareness • DART and LCOLA processes undergoing continuing evolution • Goal is to evolve initial laboratory capabilities into more operational, sustainable capability • Use prototype capabilities as guide to Govt acquisition, operations UNCLASSIFIED