Download
1 / 38
380 likes | 384 Views
Translate, Transfer, Transform: Academia, Industry and Enabling Data Analytic Tools. Martin Owen Verity Fisher. Emily Matthews David Woods. 1. 1. Why do we need to do something differently?.

E N D
Translate, Transfer, Transform: Academia, Industry and Enabling Data Analytic Tools Martin Owen Verity Fisher Emily Matthews David Woods 1 1
Why do we need to do something differently? “Because of the dissolution complexity and volume of data, it is not easy to keep all of the key results in your mind to make an informed decision. Historically only a few people have had enough working memory in their brain to do this… thus having a dashboard which visualizes the data during the meeting allows us to go beyond the limits of our brain capacity and make the right decisions”. Head of Drug Delivery , GlaxoSmithKline
What is the generalised problem we are wanting to solve? “how can we empower data creators and data users to improve the way project teams communicate risk, evaluate options through interactive models and make informed evidence-based decisions?” Case Study The support the development of a formulated product in the pharmaceutical industry • Design of formulation impact on • Stability • Dissolution
How are we going to do this? The multidisciplinary collaboration • Aim: to generate enhanced statistical design, modelling and visualisation capability. • fundamental science • development of innovative statistical methodology • implementation and application of the solutions • translation and communication of the results. Desired output • the use of maximally efficient quantitative and statistical methods, • better understanding and quantification of uncertainty and risk to product quality .
Informatics • SEEK, INCUBATE, INDUSTRIALISE the creation of task specific applications Case studies Incubation (JMP): Accelerated stability Seek (R): Modelling dissolution profiles
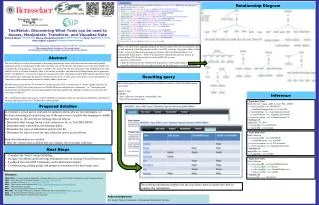
(1) Standardised, automated data import Fig 1a: Launch dashboard Fig 1b: Switch project (1c), access data tables, re-run dashboard, retrieve existing models Fig 1c: Create new project, select existing project Fig 1d: Confirm table selection, access exploratory data analysis options Fig 1d Fig 1c Fig 1b Fig 1a
(2) Exploratory Data Analysis/Cleanse data • Multifaceted views of the same data set give different insights • Does the data make sense? • Data manipulation (stack/split) occurs behind scenes
Application: Compare concepts and contrast the specifics Accelerated Stability Dissolution Standardised, automated data workflow Exploratory data analysis Views X,Y,Z..... Automated modeling and manual assessment of quality of models Observed dissolution data Observed test reference data Weibull Gompertz Asymptotic Origin Logistic Heuristic-based model selection Diagnostic evaluation • Standardised, automated data workflow • Exploratory data analysis • Views A,B,C ...... • Automated modeling and manual assessment of quality of models • Observed long term data • Relative Humidity Linear Time Kinetic • Absolute Humidity Linear Time Kinetic • Relative Humidity Accelerating Kinetic • Absolute Humidity Accelerating Kinetic • Relative Humidity Decelerating Kinetic • Absolute Humidity Decelerating Kinetic • Relative Humidity Power Model • Absolute Humidity Power Model • Heuristic-based model selection • Diagnostic evaluation
Modelling Dissolution Profiles Emily Matthews and Dave Woods Southampton Statistical Sciences Research Institute {E.S.Matthews, D. Woods}@soton.ac.uk
Introduction • Hierarchical Modelling • Stage 1 • Stage 2 • Model Assessment • Visualisation Using RStudio
Why Automate the Modelling? • Capsule experiment – non-regular fractional factorial design. • 6 factors, 16 runs. • Aim: model dissolution profiles to identify treatments which pass tests. • Profile for treatment ‘suitably’ close to the reference. • Four dissolution tests in four different media. • Capsule dissolved in three to twelve vessels per test. • 243 dissolution curves.
Two-Stage Hierarchical Model We have used a two-stage hierarchical model for the dissolution curves: • Stage 1: Fit a model to each dissolution curve: • . , ~ • Model fit assessed using R2, AIC and BIC. • Stage 2: Fit a linear regression model ~ to the p stage 1 parameter estimates. To predict the dissolution curve for a new treatment, we evaluate the stage 1 model using parameters predicted using the stage 2 model.
Example – Gompertz Model • Stage 1: • Stage 2:
Models for Stage 1 • Test 1: linear model, using lm in R. • Test 2: non-parametric model, principal components analysis (Jolliffe, 2002) using svd in R. • Test 4: Weibull model,
Modelling for Stage 2 Two methods considered to find estimates for the stage two parameters: • The Expectation-Maximisation (EM) Algorithm (Davidian and Giltinan, 1995). • Samples from the Metropolis-Hastings within Gibbs Sampling Algorithm by Matthews and Woods (2015). • Variable selection. • Model averaged predictions.
Bibliography Davidian, M. and Giltinan, D.M. (1995) Nonlinear Models for Repeated Measurement Data. No. 62 in Monographs on Statistics and Applied Probability. Florida: Chapman and Hall. Jolliffe, I.T. (2002) Principal components analysis. New York: Springer, second edn. Matthews, E.S. and Woods, D.C. (2015) A Bayesian analysis of split-plot designs with spike-and-slab priors. In Preparation.
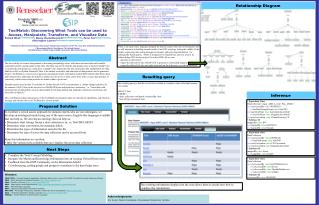
Seek and Incubate Formulation Workflow “New” model building methodology & selection (R) X Import model description Data visualisation and “Existing” Model building & selection (JMP) Dashboard Application Output for general users (JMP) Mainstream Scientific decision makers Data
Acknowledgements include.... • Case study 1 • ASAP Incubation Team • Don Clancy, Jonathan Dean, Neil Hodnett, Rachel Orr, Martin Owen, John Peterson • David Burnham (PegaAnalytics) • Case study 2 • Capsule Challenge Team • The GSK Project team members • Emily Matthews, Dave Woods, Verity Fisher