Download
1 / 1
10 likes | 179 Views
v e. K trans. v i. v i. v p. Bone marrow lesions in knees with osteoarthritis: Can parameters from dynamic contrast enhancement predict change in BML volume or knee pain change?. Andrew Gait 1 ; Tim Cootes 1 ; Elizabeth Marjanovic 1,2 ; Matt Parkes 2 ; Charles Hutchinson 3 ; David Felson 2

E N D
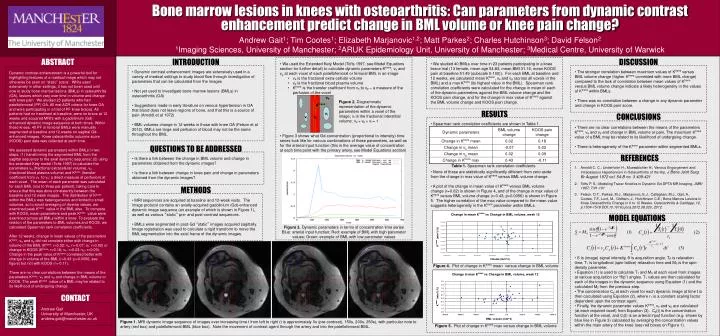
ve Ktrans vi vi vp Bone marrow lesions in knees with osteoarthritis: Can parameters from dynamic contrast enhancement predict change in BML volume or knee pain change? Andrew Gait1; Tim Cootes1; Elizabeth Marjanovic1,2; Matt Parkes2; Charles Hutchinson3; David Felson2 1Imaging Sciences, University of Manchester; 2ARUK Epidemiology Unit, University of Manchester; 3Medical Centre, University of Warwick ABSTRACT INTRODUCTION DISCUSSION • We used the Extended Kety Model (Tofts 1997, see Model Equations section for further detail) to calculate dynamic parameters Ktrans, ve and vp at each voxel of each patellofemoral or femoral BML in an image • ve is the fractional extra-cellular volume • vp is the fractional blood plasma volume • Ktrans is the transfer coefficient from ve to vp – a measure of the perfusion of the voxel • Figure 3 shows what Gd-concentration (proportional to intensity) time series look like for various combinations of these parameters, as well as for the arterial input function (this is the average value of concentration at each time point with the primary artery, see Model Equations section) • We studied 40 BMLs over time in 23 patients participating in a knee brace trial (13 female, mean age 54.83, mean BMI 31.16, mean KOOS pain at baseline 51.49 (subscale 0-100)). For each BML at baseline and 12 weeks, we calculated mean Ktrans, ve and vp (across all voxels in the BML) and a max Ktrans (its highest value in the BML). Spearman rank correlation coefficients were calculated for the change in mean of each of the dynamic parameters against the BML volume change and the KOOS pain change, and for the change in max value of Ktrans against the BML volume change and KOOS pain change. • Dynamic contrast enhancement images are extensively used in a variety of medical settings to study blood flow through investigation of parameters that can be calculated from the images • Not yet used to investigate bone marrow lesions (BMLs) in osteoarthritis (OA) • Suggestions made in early literature on venous hypertension in OA that blood does not leave regions of bone, and that this is a source of pain (Arnoldi et al 1972) • BML volumes change in 12 weeks in those with knee OA (Felson et al 2012). BMLs are large and perfusion of blood may not be the same throughout the BML. • The stronger correlation between maximum values of Ktrans versus BML volume change (higher Ktrans correlated with more BML change) compared to the lack of correlation between mean values of Ktrans versus BML volume change indicate a likely heterogeneity in the values of Ktrans within BMLs. • There was no correlation between a change in any dynamic parameter and change in KOOS pain score. Dynamic contrast enhancement is a powerful tool for highlighting features of a medical image which may not otherwise be seen on “static” scans. While used extensively in other settings, it has not been used until now to study bone marrow lesions (BMLs) in osteoarthritis (OA), lesions which vary over time in volume and change with knee pain. We studied 23 patients who had patellofemoral (PF) OA. All met ACR criteria for knee OA and were participating in a trial of PF knee braces. All patients had no treatment at baseline, were on brace at 12 weeks and acquired MRI's with a gadolinium (Gd)-enhanced dynamic image sequence at both times. Within these knees, 40 PF or femoral BMLs were manually segmented at baseline and 12 weeks on sagittal Gd-enhanced images. Knee osteoarthritis outcome score (KOOS) pain data was collected at each time. We assessed dynamic parameters within BMLs in two steps: (1) transforming the segmented BML from the sagittal sequence to the axial dynamic sequence; (2) using the extended Kety model (Tofts 1997) to calculate the parameters ve (fractional extracellular volume), vp (fractional blood plasma volume) and Ktrans (transfer coefficient from vp to ve: a direct measure of perfusion) at each voxel. The mean of each parameter was calculated for each BML (one to three per patient), taking care to ensure that this was done consistently between the baseline and 12 week images. The distribution of Ktrans within the BMLs was heterogeneous and limited to small volumes, so to avoid averaging of diverse values, we examined peak Ktrans value in the BML also. To compare with KOOS, mean parameters and peak Ktrans value were examined across all BMLs within a knee. To evaluate the relation of the parameters to BML volumes and KOOS, we calculated Spearman rank correlation coefficients. After 12 weeks, change in mean values of the parameters Ktrans, ve and vp did not correlate either with change in volume of the BML (Ktrans: r=0.02; ve: r=-0.07; vp: r=0.02) or change in KOOS (Ktrans: r=0.18; ve: r=0.03; vp: r=0.09). Change in the peak value of Ktrans correlated better with change in volume of the BML (r=0.43: p=0.0056, see figure) but not with KOOS (r=-0.11). There are no clear correlations between the means of the parameters Ktrans, ve and vp and change in BML volume or KOOS. The peak Ktrans value of a BML may be related to its likelihood of undergoing change. Figure 2. Diagrammatic representation of the dynamic parameters within a voxel of the image; vi is the fractional interstitial volume: ve + vp + vi = 1 RESULTS CONCLUSIONS • Spearman rank correlation coefficients are shown in Table 1. • None of these are statistically significantly different from zero aside from the change in max value of Ktrans versus BML volume change. • A plot of the change in mean value of Ktrans versus BML volume change (r=0.02) is shown in Figure 4, and of the change in max value of Ktrans versus BML volume change (r=0.43, p=0.0056) is shown in Figure 5. The higher correlation of the max value compared to the mean value suggests heterogeneity in the Ktrans parameter within BMLs. • There are no clear correlations between the means of the parameters Ktrans, ve and vp and change in BML volume or pain. The maximum Ktrans value of a BML may be related to its likelihood of undergoing change. • There is heterogeneity of the Ktrans parameter within segmented BMLs. QUESTIONS TO BE ADDRESSED • Is there a link between the change in BML volume and change inparameters obtained from the dynamic images? • Is there a link between change in knee painand change in parameters obtained from the dynamic images? REFERENCES • Arnoldi C. C., Linderholm H., Muessbichler H.; Venous Engorgement and Intraosseous Hypertension in Osteoarthritis of the Hip, J Bone Joint Surg Br August 1972 vol. 54-B no. 3 409-421 • Tofts P. S.; Modeling Tracer Kinetics in Dynamic Gd-DPTA MR Imaging, JMRI 1997; 7:91-101 • Felson, D.T., Parkes, M.J., Marjanovic, E.J., Callaghan, M.J., Gait, A., Cootes, T.F., Lunt, M., Oldham, J., Hutchinson C.E.; Bone Marrow Lesions in Knee Osteoarthritis Change in 6 to 12 Weeks. Osteoarthritis & Cartilage, 12, p.1504-1518 DOI:10.1016/j.joca.2012.08.020, 2012 Table 1. Spearman rank correlation coefficients METHODS • MRI sequences are acquired at baseline and 12-week visits. The image protocol contains an axially-acquired gadolinium (Gd)-enhanced dynamic image sequence (an example of which is shown in Figure 1), as well as various “static” pre- and post-contrast sequences. • BMLs were segmented in post-Gd “static” images acquired sagittally. Image registration was used to calculate a rigid transform to move the BML segmentation into the axial frame of the dynamic images. MODEL EQUATIONS • S is (image) signal intensity, θ is acquisition angle, TR is relaxation time, T1 is longitudinal (spin-lattice) relaxation time and M0 is the spin-density parameter. • Equation (1) is used to calculate T1 and M0 at each voxel from images at various acquisition (or “flip”) angles. T1 values are then calculated for each of the images in the dynamic sequence using Equation (1) and the calculated M0 from the previous step. • The concentration Cp at each voxel for each dynamic image at time t is then calculated using Equation (2), where r1 is a constant scaling factor dependent upon the contrast agent. • Finally, the dynamic parameter values Ktrans, ve and vp are calculated (at each required voxel) from Equation (3). Cp(t) is the concentration function at the voxel, and Ct(t) is an arterial input function (e.g. shown by blue line in Figure 3) calculated by averaging the concentration values within the main artery of the knee (see red boxes on Figure 1). Figure 3. Dynamic parameters in terms of concentration time series Blue: arterial input function; Red: example ofBML with high parameter values; Green: example ofBML with low parameter values Figure 4. Plot of change in Ktrans mean versus change in BML volume CONTACT Andrew Gait University of Manchester, UK andrew.gait@manchester.ac.uk Figure 1. MRI dynamic image sequence of images over increasing time t from left to right (t is approximately 0s (pre-contrast), 150s, 200s, 250s), with particular note to artery (red box) and patellofemoral BML (blue box). Note the movement of contrast agent through the artery and into the patellofemoral BML. Figure 5. Plot of change in Ktrans max versus change in BML volume