Download

1 / 14
140 likes | 263 Views
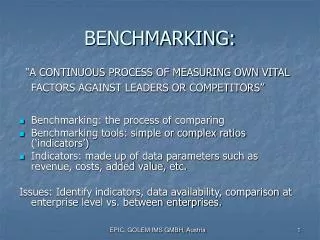
Benchmarking. Techniques & Application. Benchmarking. Used to identify standards that are critical to a company’s success Used to compare: Actual Performance Determination of gaps in performance Implementation of improvements External benchmarks are typically best practice.

E N D
Benchmarking Techniques & Application
Benchmarking • Used to identify standards that are critical to a company’s success • Used to compare: • Actual Performance • Determination of gaps in performance • Implementation of improvements • External benchmarks are typically best practice
External Benchmarking Productivity Measures • Productivity- ratio of outputs achieved to inputs into production • Objectives of Productivity Measures: • Were all inputs used needed to produce the actual output? • Was the best mix of inputs used?
Productivity Ratios • Partial Productivity Ratios (PPRs) • Reflect the value of all outputs as compared to the value of major categories of input. • Concerned only with the quantity of a single output and not the price of input • Calculation: • Quantity of output produced/quantity of the single input used • Total Productivity Ratios (TPRs) • Reflect the value of all output relative to the value of all input. • Consider all inputs and the prices of the inputs • Calculation: Quantity of output produced/cost of inputs
How to Externally Benchmark • BOMA (Building Owners and Managers Association International) • IMFA (International Facility Management Association) • It’s good practice to compare “apples to apples” • Common Benchmarks: • Safety, Security, and Workplace Standards • Cost Per Person, Gross Square Feet Per Person
InternalBenchmarking Monitoring & Investigative Techniques: • Control Charts 2. Pareto Diagrams 3. Cause & Effect (Fishbone) Diagram
InternalBenchmarking • Control Charts • 3 Basic Components • Common Cause, “noise” • Special Cause, “signal”
InternalBenchmarking • Pareto Diagrams • Use • Interpretation
InternalBenchmarking • Cause and Effect Diagram • “Fishbone Diagram” Machinery Method Materials Manpower Measurements Environment
Process Improvements & Activity-Based Management • Activity Based Costing a. Allocating Costs b. Identifying Necessary Activities c. Process d. Determining Driving Costs e. Companies with Multiple Products f. Pricing and Outsourcing Decisions
Process Improvements & Activity-Based Management 2. Activity Based Management Using ABC to determine… a. Where are Overhead Costs Allocated? b. Should we Outsource Processes? c. Should Prices Change?
Process Improvements & Activity-Based Management 3. Cost Identification a. Value Adding vs. Non-Value Adding Activities b. Exact Costs of Each Unit c. Cost Data by Activity